Immigrants from Chile vs Dutch West Indian 4th Grade
COMPARE
Immigrants from Chile
Dutch West Indian
4th Grade
4th Grade Comparison
Immigrants from Chile
Dutch West Indians
97.4%
4TH GRADE
16.1/ 100
METRIC RATING
202nd/ 347
METRIC RANK
97.5%
4TH GRADE
35.8/ 100
METRIC RATING
186th/ 347
METRIC RANK
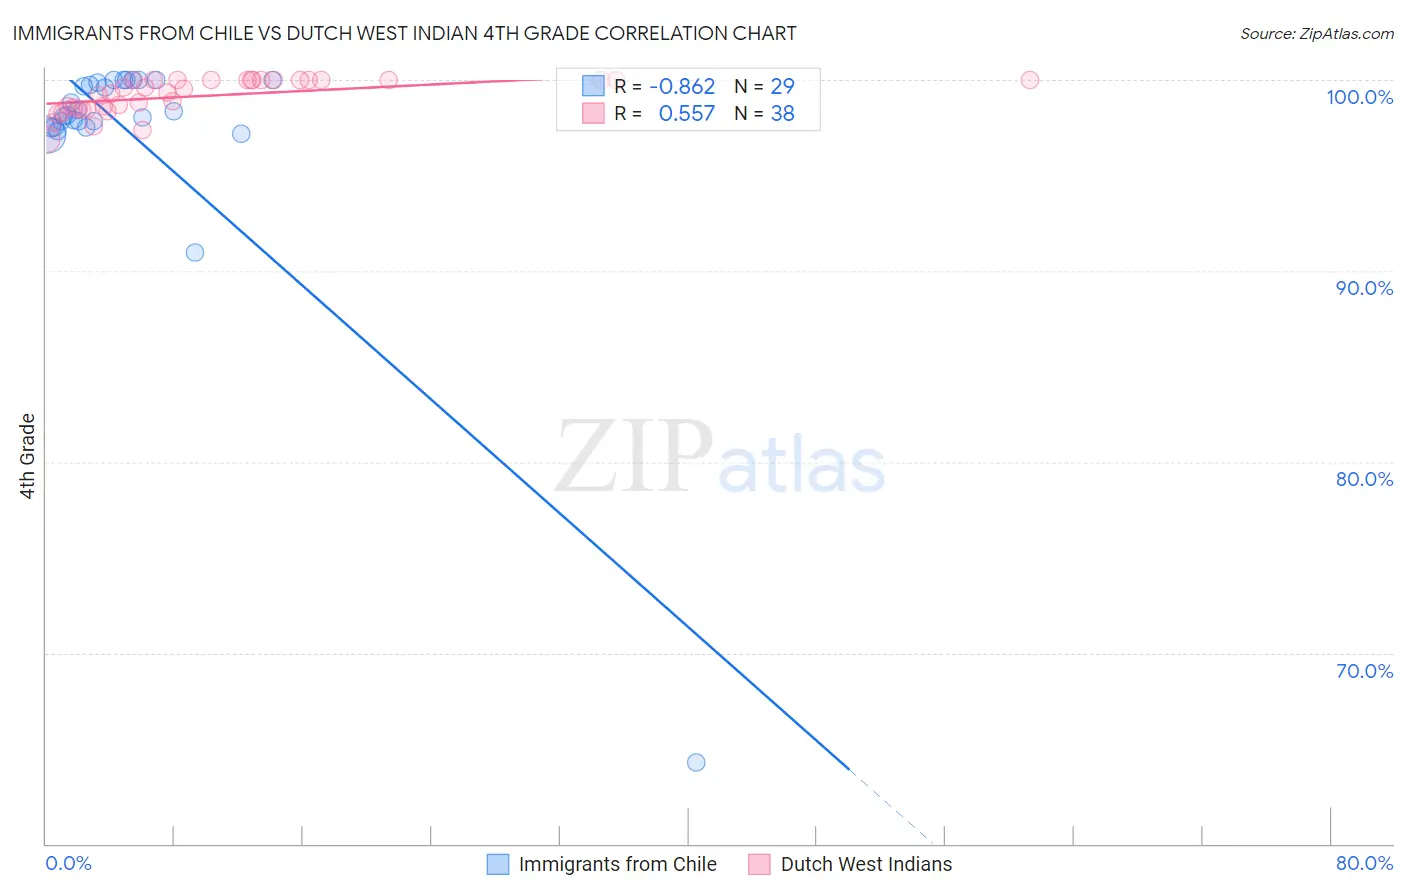
Immigrants from Chile vs Dutch West Indian 4th Grade Correlation Chart
The statistical analysis conducted on geographies consisting of 218,647,266 people shows a very strong negative correlation between the proportion of Immigrants from Chile and percentage of population with at least 4th grade education in the United States with a correlation coefficient (R) of -0.862 and weighted average of 97.4%. Similarly, the statistical analysis conducted on geographies consisting of 85,776,075 people shows a substantial positive correlation between the proportion of Dutch West Indians and percentage of population with at least 4th grade education in the United States with a correlation coefficient (R) of 0.557 and weighted average of 97.5%, a difference of 0.10%.
4th Grade Correlation Summary
| Measurement | Immigrants from Chile | Dutch West Indian |
| Minimum | 64.3% | 96.9% |
| Maximum | 100.0% | 100.0% |
| Range | 35.7% | 3.1% |
| Mean | 97.2% | 99.2% |
| Median | 98.1% | 99.5% |
| Interquartile 25% (IQ1) | 97.5% | 98.5% |
| Interquartile 75% (IQ3) | 99.9% | 100.0% |
| Interquartile Range (IQR) | 2.4% | 1.5% |
| Standard Deviation (Sample) | 6.6% | 0.89% |
| Standard Deviation (Population) | 6.5% | 0.88% |
Demographics Similar to Immigrants from Chile and Dutch West Indians by 4th Grade
In terms of 4th grade, the demographic groups most similar to Immigrants from Chile are Immigrants from Southern Europe (97.4%, a difference of 0.0%), Immigrants from Northern Africa (97.4%, a difference of 0.010%), African (97.4%, a difference of 0.010%), Immigrants from Uganda (97.4%, a difference of 0.020%), and Native/Alaskan (97.4%, a difference of 0.030%). Similarly, the demographic groups most similar to Dutch West Indians are Pakistani (97.5%, a difference of 0.0%), Immigrants from Kenya (97.5%, a difference of 0.0%), Mongolian (97.5%, a difference of 0.0%), Immigrants from Argentina (97.5%, a difference of 0.0%), and Panamanian (97.4%, a difference of 0.020%).
| Demographics | Rating | Rank | 4th Grade |
| Pakistanis | 36.2 /100 | #184 | Fair 97.5% |
| Immigrants | Kenya | 35.8 /100 | #185 | Fair 97.5% |
| Dutch West Indians | 35.8 /100 | #186 | Fair 97.5% |
| Mongolians | 34.7 /100 | #187 | Fair 97.5% |
| Immigrants | Argentina | 34.6 /100 | #188 | Fair 97.5% |
| Panamanians | 31.9 /100 | #189 | Fair 97.4% |
| Blacks/African Americans | 31.1 /100 | #190 | Fair 97.4% |
| Navajo | 30.7 /100 | #191 | Fair 97.4% |
| Immigrants | Ukraine | 30.1 /100 | #192 | Fair 97.4% |
| Immigrants | Egypt | 30.1 /100 | #193 | Fair 97.4% |
| Portuguese | 29.2 /100 | #194 | Fair 97.4% |
| Paraguayans | 28.9 /100 | #195 | Fair 97.4% |
| Immigrants | Albania | 27.7 /100 | #196 | Fair 97.4% |
| Hawaiians | 25.6 /100 | #197 | Fair 97.4% |
| Guamanians/Chamorros | 23.0 /100 | #198 | Fair 97.4% |
| Natives/Alaskans | 20.6 /100 | #199 | Fair 97.4% |
| Immigrants | Uganda | 19.8 /100 | #200 | Poor 97.4% |
| Immigrants | Southern Europe | 16.2 /100 | #201 | Poor 97.4% |
| Immigrants | Chile | 16.1 /100 | #202 | Poor 97.4% |
| Immigrants | Northern Africa | 15.1 /100 | #203 | Poor 97.4% |
| Africans | 14.6 /100 | #204 | Poor 97.4% |