Immigrants from Caribbean vs Immigrants from Thailand Disability Age 5 to 17
COMPARE
Immigrants from Caribbean
Immigrants from Thailand
Disability Age 5 to 17
Disability Age 5 to 17 Comparison
Immigrants from Caribbean
Immigrants from Thailand
5.9%
DISABILITY AGE 5 TO 17
2.1/ 100
METRIC RATING
241st/ 347
METRIC RANK
5.7%
DISABILITY AGE 5 TO 17
30.2/ 100
METRIC RATING
187th/ 347
METRIC RANK
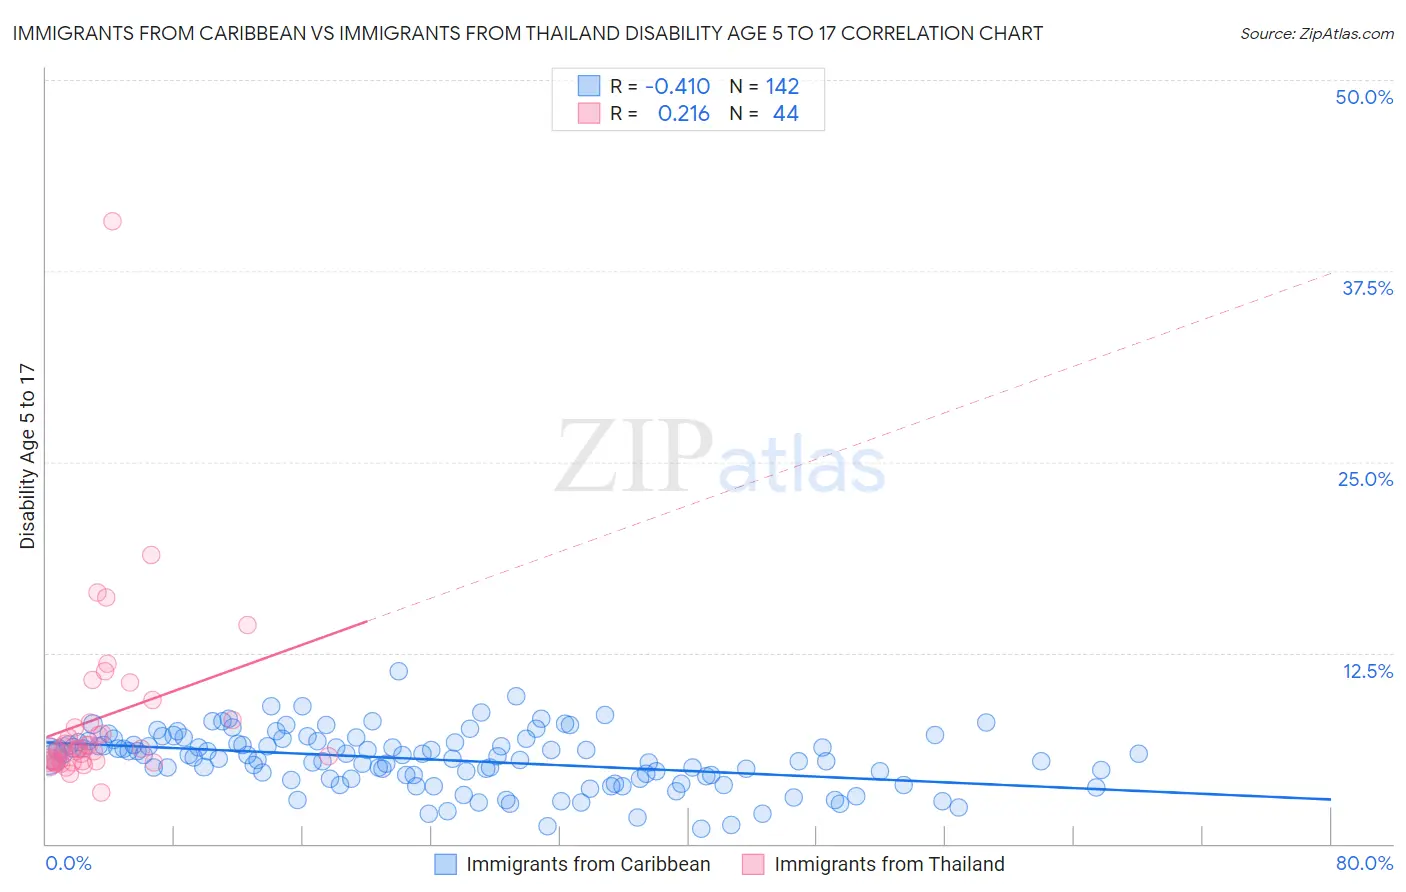
Immigrants from Caribbean vs Immigrants from Thailand Disability Age 5 to 17 Correlation Chart
The statistical analysis conducted on geographies consisting of 445,217,348 people shows a moderate negative correlation between the proportion of Immigrants from Caribbean and percentage of population with a disability between the ages 5 and 17 in the United States with a correlation coefficient (R) of -0.410 and weighted average of 5.9%. Similarly, the statistical analysis conducted on geographies consisting of 315,092,447 people shows a weak positive correlation between the proportion of Immigrants from Thailand and percentage of population with a disability between the ages 5 and 17 in the United States with a correlation coefficient (R) of 0.216 and weighted average of 5.7%, a difference of 3.6%.
Disability Age 5 to 17 Correlation Summary
| Measurement | Immigrants from Caribbean | Immigrants from Thailand |
| Minimum | 1.0% | 3.4% |
| Maximum | 11.3% | 40.7% |
| Range | 10.3% | 37.4% |
| Mean | 5.5% | 8.2% |
| Median | 5.7% | 6.2% |
| Interquartile 25% (IQ1) | 4.3% | 5.4% |
| Interquartile 75% (IQ3) | 6.7% | 8.0% |
| Interquartile Range (IQR) | 2.4% | 2.6% |
| Standard Deviation (Sample) | 1.9% | 6.1% |
| Standard Deviation (Population) | 1.8% | 6.0% |
Similar Demographics by Disability Age 5 to 17
Demographics Similar to Immigrants from Caribbean by Disability Age 5 to 17
In terms of disability age 5 to 17, the demographic groups most similar to Immigrants from Caribbean are Spaniard (5.9%, a difference of 0.080%), Indonesian (5.9%, a difference of 0.090%), West Indian (5.9%, a difference of 0.13%), German Russian (5.9%, a difference of 0.15%), and Immigrants from Germany (5.9%, a difference of 0.15%).
| Demographics | Rating | Rank | Disability Age 5 to 17 |
| Immigrants | Kenya | 3.4 /100 | #234 | Tragic 5.8% |
| Malaysians | 3.4 /100 | #235 | Tragic 5.8% |
| Immigrants | Brazil | 3.2 /100 | #236 | Tragic 5.8% |
| Sudanese | 2.9 /100 | #237 | Tragic 5.8% |
| Hungarians | 2.6 /100 | #238 | Tragic 5.8% |
| German Russians | 2.4 /100 | #239 | Tragic 5.9% |
| West Indians | 2.4 /100 | #240 | Tragic 5.9% |
| Immigrants | Caribbean | 2.1 /100 | #241 | Tragic 5.9% |
| Spaniards | 2.0 /100 | #242 | Tragic 5.9% |
| Indonesians | 2.0 /100 | #243 | Tragic 5.9% |
| Immigrants | Germany | 1.9 /100 | #244 | Tragic 5.9% |
| Immigrants | Micronesia | 1.9 /100 | #245 | Tragic 5.9% |
| Tlingit-Haida | 1.9 /100 | #246 | Tragic 5.9% |
| Immigrants | Honduras | 1.8 /100 | #247 | Tragic 5.9% |
| British | 1.7 /100 | #248 | Tragic 5.9% |
Demographics Similar to Immigrants from Thailand by Disability Age 5 to 17
In terms of disability age 5 to 17, the demographic groups most similar to Immigrants from Thailand are Fijian (5.7%, a difference of 0.090%), Marshallese (5.7%, a difference of 0.12%), Pueblo (5.7%, a difference of 0.16%), Immigrants from Eastern Africa (5.7%, a difference of 0.17%), and Syrian (5.6%, a difference of 0.20%).
| Demographics | Rating | Rank | Disability Age 5 to 17 |
| Immigrants | Uruguay | 37.7 /100 | #180 | Fair 5.6% |
| Immigrants | England | 36.4 /100 | #181 | Fair 5.6% |
| Mexican American Indians | 35.2 /100 | #182 | Fair 5.6% |
| Immigrants | Latin America | 34.3 /100 | #183 | Fair 5.6% |
| Syrians | 33.8 /100 | #184 | Fair 5.6% |
| Immigrants | Mexico | 33.7 /100 | #185 | Fair 5.6% |
| Fijians | 31.7 /100 | #186 | Fair 5.7% |
| Immigrants | Thailand | 30.2 /100 | #187 | Fair 5.7% |
| Marshallese | 28.1 /100 | #188 | Fair 5.7% |
| Pueblo | 27.5 /100 | #189 | Fair 5.7% |
| Immigrants | Eastern Africa | 27.3 /100 | #190 | Fair 5.7% |
| Danes | 26.5 /100 | #191 | Fair 5.7% |
| Immigrants | Bosnia and Herzegovina | 26.3 /100 | #192 | Fair 5.7% |
| Immigrants | Canada | 26.1 /100 | #193 | Fair 5.7% |
| Croatians | 23.6 /100 | #194 | Fair 5.7% |