Immigrants from Canada vs Immigrants from Eastern Africa Disability
COMPARE
Immigrants from Canada
Immigrants from Eastern Africa
Disability
Disability Comparison
Immigrants from Canada
Immigrants from Eastern Africa
12.1%
DISABILITY
6.1/ 100
METRIC RATING
215th/ 347
METRIC RANK
11.3%
DISABILITY
96.7/ 100
METRIC RATING
102nd/ 347
METRIC RANK
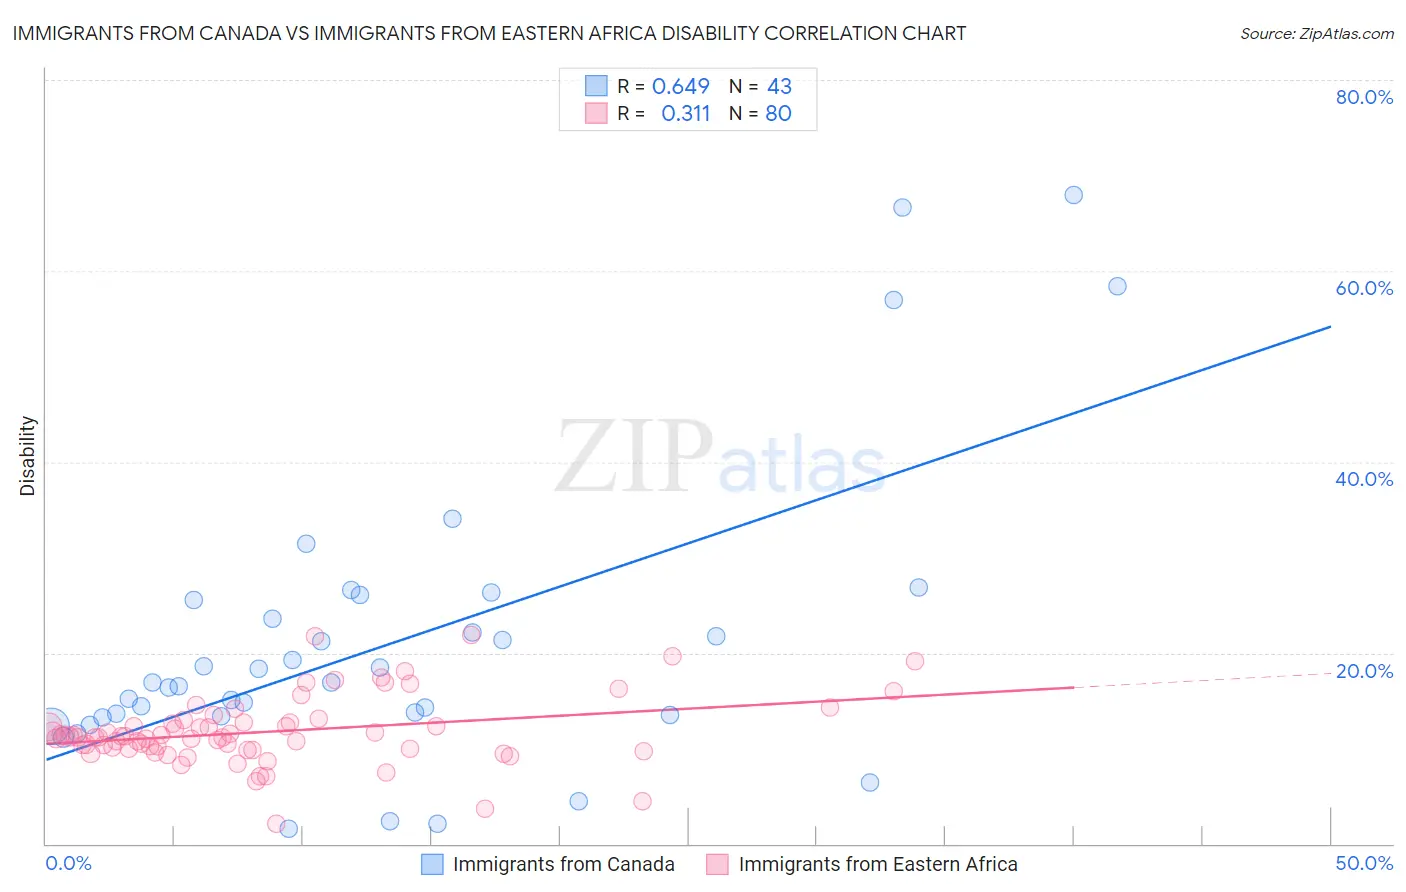
Immigrants from Canada vs Immigrants from Eastern Africa Disability Correlation Chart
The statistical analysis conducted on geographies consisting of 459,374,446 people shows a significant positive correlation between the proportion of Immigrants from Canada and percentage of population with a disability in the United States with a correlation coefficient (R) of 0.649 and weighted average of 12.1%. Similarly, the statistical analysis conducted on geographies consisting of 355,125,072 people shows a mild positive correlation between the proportion of Immigrants from Eastern Africa and percentage of population with a disability in the United States with a correlation coefficient (R) of 0.311 and weighted average of 11.3%, a difference of 7.0%.
Disability Correlation Summary
| Measurement | Immigrants from Canada | Immigrants from Eastern Africa |
| Minimum | 1.6% | 2.1% |
| Maximum | 68.0% | 21.8% |
| Range | 66.4% | 19.7% |
| Mean | 21.0% | 11.7% |
| Median | 16.9% | 11.2% |
| Interquartile 25% (IQ1) | 13.3% | 10.0% |
| Interquartile 75% (IQ3) | 25.6% | 12.7% |
| Interquartile Range (IQR) | 12.2% | 2.7% |
| Standard Deviation (Sample) | 15.3% | 3.5% |
| Standard Deviation (Population) | 15.2% | 3.5% |
Similar Demographics by Disability
Demographics Similar to Immigrants from Canada by Disability
In terms of disability, the demographic groups most similar to Immigrants from Canada are Immigrants from Somalia (12.0%, a difference of 0.13%), Panamanian (12.1%, a difference of 0.15%), Immigrants from North America (12.1%, a difference of 0.16%), Austrian (12.0%, a difference of 0.18%), and Immigrants from Iraq (12.0%, a difference of 0.18%).
| Demographics | Rating | Rank | Disability |
| Immigrants | Caribbean | 9.1 /100 | #208 | Tragic 12.0% |
| Danes | 8.7 /100 | #209 | Tragic 12.0% |
| Czechs | 7.9 /100 | #210 | Tragic 12.0% |
| Immigrants | Cambodia | 7.3 /100 | #211 | Tragic 12.0% |
| Austrians | 7.2 /100 | #212 | Tragic 12.0% |
| Immigrants | Iraq | 7.1 /100 | #213 | Tragic 12.0% |
| Immigrants | Somalia | 6.8 /100 | #214 | Tragic 12.0% |
| Immigrants | Canada | 6.1 /100 | #215 | Tragic 12.1% |
| Panamanians | 5.4 /100 | #216 | Tragic 12.1% |
| Immigrants | North America | 5.3 /100 | #217 | Tragic 12.1% |
| Immigrants | Jamaica | 5.0 /100 | #218 | Tragic 12.1% |
| Croatians | 4.9 /100 | #219 | Tragic 12.1% |
| Immigrants | Bahamas | 4.7 /100 | #220 | Tragic 12.1% |
| Northern Europeans | 4.2 /100 | #221 | Tragic 12.1% |
| Spanish American Indians | 4.1 /100 | #222 | Tragic 12.1% |
Demographics Similar to Immigrants from Eastern Africa by Disability
In terms of disability, the demographic groups most similar to Immigrants from Eastern Africa are Immigrants from Nicaragua (11.3%, a difference of 0.060%), Immigrants from Uruguay (11.3%, a difference of 0.070%), Immigrants (11.3%, a difference of 0.080%), Immigrants from Kazakhstan (11.3%, a difference of 0.090%), and Immigrants from Greece (11.3%, a difference of 0.11%).
| Demographics | Rating | Rank | Disability |
| Eastern Europeans | 97.8 /100 | #95 | Exceptional 11.2% |
| Immigrants | Zimbabwe | 97.7 /100 | #96 | Exceptional 11.2% |
| Bhutanese | 97.4 /100 | #97 | Exceptional 11.2% |
| Uruguayans | 97.4 /100 | #98 | Exceptional 11.2% |
| Immigrants | Czechoslovakia | 97.4 /100 | #99 | Exceptional 11.2% |
| Immigrants | Greece | 96.9 /100 | #100 | Exceptional 11.3% |
| Immigrants | Nicaragua | 96.8 /100 | #101 | Exceptional 11.3% |
| Immigrants | Eastern Africa | 96.7 /100 | #102 | Exceptional 11.3% |
| Immigrants | Uruguay | 96.4 /100 | #103 | Exceptional 11.3% |
| Immigrants | Immigrants | 96.4 /100 | #104 | Exceptional 11.3% |
| Immigrants | Kazakhstan | 96.4 /100 | #105 | Exceptional 11.3% |
| Immigrants | Eastern Europe | 96.3 /100 | #106 | Exceptional 11.3% |
| Nicaraguans | 96.2 /100 | #107 | Exceptional 11.3% |
| Immigrants | Nigeria | 96.0 /100 | #108 | Exceptional 11.3% |
| Immigrants | Uganda | 95.7 /100 | #109 | Exceptional 11.3% |