Immigrants from Canada vs Iraqi Disability
COMPARE
Immigrants from Canada
Iraqi
Disability
Disability Comparison
Immigrants from Canada
Iraqis
12.1%
DISABILITY
6.1/ 100
METRIC RATING
215th/ 347
METRIC RANK
11.8%
DISABILITY
30.0/ 100
METRIC RATING
184th/ 347
METRIC RANK
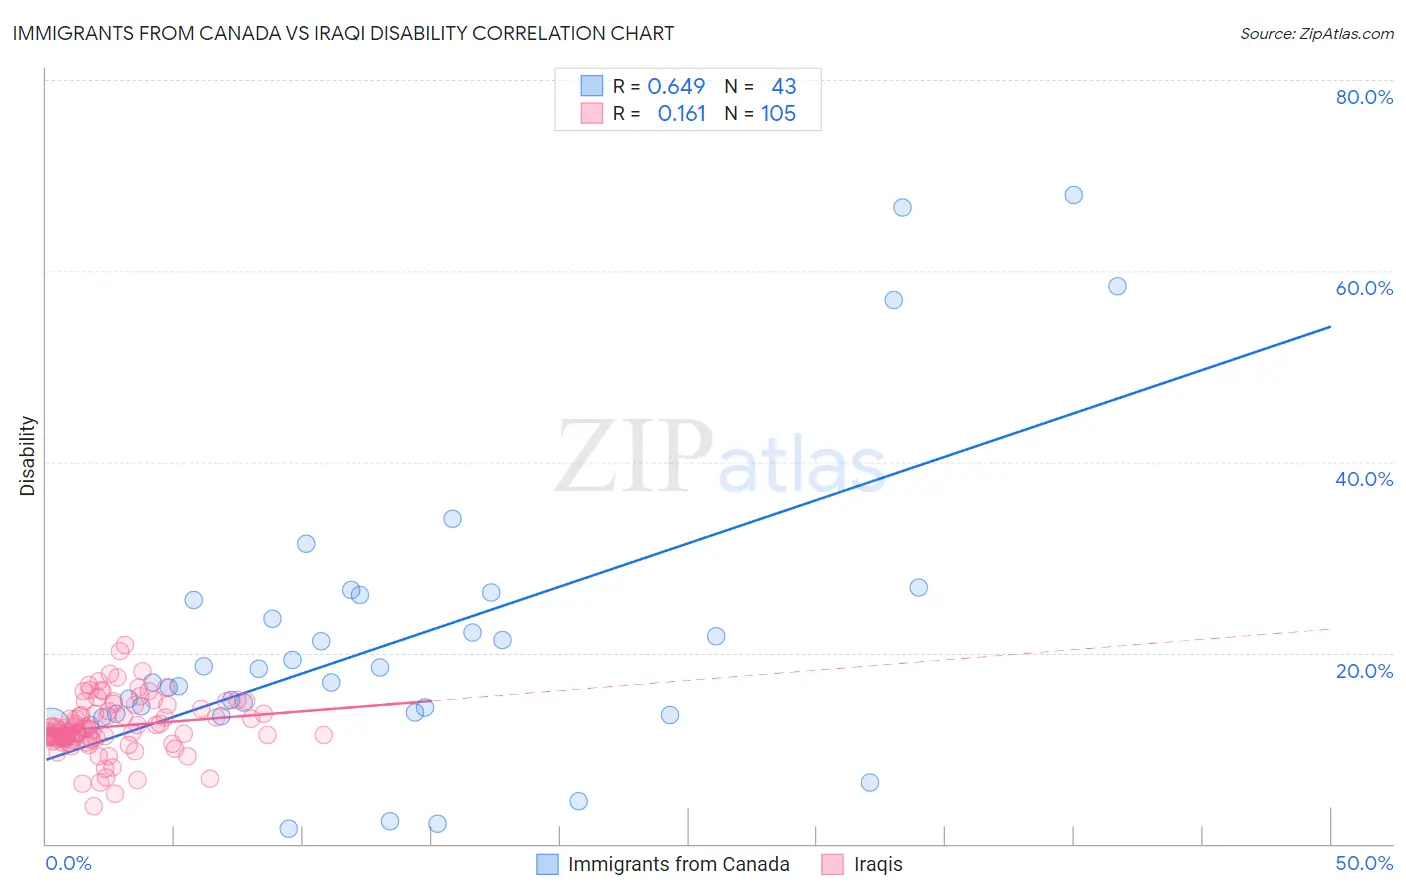
Immigrants from Canada vs Iraqi Disability Correlation Chart
The statistical analysis conducted on geographies consisting of 459,374,446 people shows a significant positive correlation between the proportion of Immigrants from Canada and percentage of population with a disability in the United States with a correlation coefficient (R) of 0.649 and weighted average of 12.1%. Similarly, the statistical analysis conducted on geographies consisting of 170,650,959 people shows a poor positive correlation between the proportion of Iraqis and percentage of population with a disability in the United States with a correlation coefficient (R) of 0.161 and weighted average of 11.8%, a difference of 2.1%.
Disability Correlation Summary
| Measurement | Immigrants from Canada | Iraqi |
| Minimum | 1.6% | 3.9% |
| Maximum | 68.0% | 20.8% |
| Range | 66.4% | 16.9% |
| Mean | 21.0% | 12.3% |
| Median | 16.9% | 11.8% |
| Interquartile 25% (IQ1) | 13.3% | 11.0% |
| Interquartile 75% (IQ3) | 25.6% | 14.0% |
| Interquartile Range (IQR) | 12.2% | 3.0% |
| Standard Deviation (Sample) | 15.3% | 2.9% |
| Standard Deviation (Population) | 15.2% | 2.9% |
Similar Demographics by Disability
Demographics Similar to Immigrants from Canada by Disability
In terms of disability, the demographic groups most similar to Immigrants from Canada are Immigrants from Somalia (12.0%, a difference of 0.13%), Panamanian (12.1%, a difference of 0.15%), Immigrants from North America (12.1%, a difference of 0.16%), Austrian (12.0%, a difference of 0.18%), and Immigrants from Iraq (12.0%, a difference of 0.18%).
| Demographics | Rating | Rank | Disability |
| Immigrants | Caribbean | 9.1 /100 | #208 | Tragic 12.0% |
| Danes | 8.7 /100 | #209 | Tragic 12.0% |
| Czechs | 7.9 /100 | #210 | Tragic 12.0% |
| Immigrants | Cambodia | 7.3 /100 | #211 | Tragic 12.0% |
| Austrians | 7.2 /100 | #212 | Tragic 12.0% |
| Immigrants | Iraq | 7.1 /100 | #213 | Tragic 12.0% |
| Immigrants | Somalia | 6.8 /100 | #214 | Tragic 12.0% |
| Immigrants | Canada | 6.1 /100 | #215 | Tragic 12.1% |
| Panamanians | 5.4 /100 | #216 | Tragic 12.1% |
| Immigrants | North America | 5.3 /100 | #217 | Tragic 12.1% |
| Immigrants | Jamaica | 5.0 /100 | #218 | Tragic 12.1% |
| Croatians | 4.9 /100 | #219 | Tragic 12.1% |
| Immigrants | Bahamas | 4.7 /100 | #220 | Tragic 12.1% |
| Northern Europeans | 4.2 /100 | #221 | Tragic 12.1% |
| Spanish American Indians | 4.1 /100 | #222 | Tragic 12.1% |
Demographics Similar to Iraqis by Disability
In terms of disability, the demographic groups most similar to Iraqis are Honduran (11.8%, a difference of 0.060%), Immigrants from Burma/Myanmar (11.8%, a difference of 0.080%), Immigrants from Scotland (11.8%, a difference of 0.090%), Lebanese (11.8%, a difference of 0.11%), and Icelander (11.8%, a difference of 0.20%).
| Demographics | Rating | Rank | Disability |
| Immigrants | Central America | 46.6 /100 | #177 | Average 11.7% |
| Greeks | 46.2 /100 | #178 | Average 11.7% |
| Immigrants | Armenia | 41.9 /100 | #179 | Average 11.7% |
| Immigrants | Honduras | 37.8 /100 | #180 | Fair 11.8% |
| Immigrants | Oceania | 34.3 /100 | #181 | Fair 11.8% |
| Icelanders | 34.0 /100 | #182 | Fair 11.8% |
| Hondurans | 31.2 /100 | #183 | Fair 11.8% |
| Iraqis | 30.0 /100 | #184 | Fair 11.8% |
| Immigrants | Burma/Myanmar | 28.5 /100 | #185 | Fair 11.8% |
| Immigrants | Scotland | 28.2 /100 | #186 | Fair 11.8% |
| Lebanese | 27.9 /100 | #187 | Fair 11.8% |
| Immigrants | Mexico | 23.8 /100 | #188 | Fair 11.9% |
| Immigrants | Zaire | 21.8 /100 | #189 | Fair 11.9% |
| Immigrants | West Indies | 21.1 /100 | #190 | Fair 11.9% |
| Ute | 19.5 /100 | #191 | Poor 11.9% |