Kiowa vs Immigrants from Asia Disability Age Under 5

COMPARE

Kiowa
Race
Ancestry
AfghanAfricanAlaska NativeAlaskan AthabascanAlbanianAleutAlsatianAmericanApacheArabArapahoArgentineanArmenianAssyrian/Chaldean/SyriacAustralianAustrianBahamianBangladeshiBarbadianBasqueBelgianBelizeanBermudanBhutaneseBlackfeetBolivianBrazilianBritishBritish West IndianBulgarianBurmeseCajunCambodianCanadianCape VerdeanCarpatho RusynCelticCentral AmericanCentral American IndianCherokeeCheyenneChickasawChileanChineseChippewaChoctawColombianColvilleComancheCosta RicanCreeCreekCroatianCrowCubanCypriotCzechCzechoslovakianDanishDelawareDominicanDutchDutch West IndianEastern EuropeanEcuadorianEgyptianEnglishEstonianEthiopianEuropeanFijianFilipinoFinnishFrenchFrench American IndianFrench CanadianGermanGerman RussianGhanaianGreekGuamanian/ChamorroGuatemalanGuyaneseHaitianHmongHonduranHopiHoumaHungarianIcelanderIndian (Asian)IndonesianInupiatIranianIraqiIrishIroquoisIsraeliItalianJamaicanJapaneseJordanianKenyanKiowaKoreanLaotianLatvianLebaneseLiberianLithuanianLumbeeLuxembourgerMacedonianMalaysianMalteseMarshalleseMenomineeMexicanMexican American IndianMongolianMoroccanNative HawaiianNavajoNepaleseNew ZealanderNicaraguanNigerianNorthern EuropeanNorwegianOkinawanOsageOttawaPaiutePakistaniPalestinianPanamanianParaguayanPennsylvania GermanPeruvianPimaPolishPortuguesePotawatomiPuebloPuerto RicanPuget Sound SalishRomanianRussianSalvadoranSamoanScandinavianScotch-IrishScottishSeminoleSenegaleseSerbianShoshoneSierra LeoneanSiouxSlavicSlovakSloveneSomaliSouth AfricanSouth AmericanSouth American IndianSoviet UnionSpaniardSpanishSpanish AmericanSpanish American IndianSri LankanSubsaharan AfricanSudaneseSwedishSwissSyrianTaiwaneseThaiTlingit-HaidaTohono O'OdhamTonganTrinidadian and TobagonianTsimshianTurkishU.S. Virgin IslanderUgandanUkrainianUruguayanUteVenezuelanVietnameseWelshWest IndianYakamaYaquiYugoslavianYumanYup'ikZimbabwean
Immigration
NonimmigrantsImmigrantsAfghanistanAfricaAlbaniaArgentinaArmeniaAustraliaAustriaBahamasBangladeshBarbadosBelarusBelgiumBelizeBoliviaBosnia and HerzegovinaBrazilBulgariaBurma/MyanmarCabo VerdeCambodiaCameroonCanadaCaribbeanCentral AmericaChileChinaColombiaCongoCosta RicaCroatiaCubaCzechoslovakiaDenmarkDominicaDominican RepublicEastern AfricaEastern AsiaEastern EuropeEcuadorEgyptEl SalvadorEnglandEritreaEthiopiaEuropeFijiFranceGermanyGhanaGreeceGrenadaGuatemalaGuyanaHaitiHondurasHong KongHungaryIndiaIndonesiaIranIraqIrelandIsraelItalyJamaicaJapanJordanKazakhstanKenyaKoreaKuwaitLaosLatin AmericaLatviaLebanonLiberiaLithuaniaMalaysiaMexicoMicronesiaMiddle AfricaMoldovaMoroccoNepalNetherlandsNicaraguaNigeriaNorth AmericaNorth MacedoniaNorthern AfricaNorthern EuropeNorwayOceaniaPakistanPanamaPeruPhilippinesPolandPortugalRomaniaRussiaSaudi ArabiaScotlandSenegalSerbiaSierra LeoneSingaporeSomaliaSouth AfricaSouth AmericaSouth Central AsiaSouth Eastern AsiaSouthern EuropeSpainSri LankaSt. Vincent and the GrenadinesSudanSwedenSwitzerlandSyriaTaiwanThailandTrinidad and TobagoTurkeyUgandaUkraineUruguayUzbekistanVenezuelaVietnamWest IndiesWestern AfricaWestern AsiaWestern EuropeYemenZaireZimbabweAzores
Immigrants from Asia
Race
Ancestry
AfghanAfricanAlaska NativeAlaskan AthabascanAlbanianAleutAlsatianAmericanApacheArabArapahoArgentineanArmenianAssyrian/Chaldean/SyriacAustralianAustrianBahamianBangladeshiBarbadianBasqueBelgianBelizeanBermudanBhutaneseBlackfeetBolivianBrazilianBritishBritish West IndianBulgarianBurmeseCajunCambodianCanadianCape VerdeanCarpatho RusynCelticCentral AmericanCentral American IndianCherokeeCheyenneChickasawChileanChineseChippewaChoctawColombianColvilleComancheCosta RicanCreeCreekCroatianCrowCubanCypriotCzechCzechoslovakianDanishDelawareDominicanDutchDutch West IndianEastern EuropeanEcuadorianEgyptianEnglishEstonianEthiopianEuropeanFijianFilipinoFinnishFrenchFrench American IndianFrench CanadianGermanGerman RussianGhanaianGreekGuamanian/ChamorroGuatemalanGuyaneseHaitianHmongHonduranHopiHoumaHungarianIcelanderIndian (Asian)IndonesianInupiatIranianIraqiIrishIroquoisIsraeliItalianJamaicanJapaneseJordanianKenyanKoreanLaotianLatvianLebaneseLiberianLithuanianLumbeeLuxembourgerMacedonianMalaysianMalteseMarshalleseMenomineeMexicanMexican American IndianMongolianMoroccanNative HawaiianNavajoNepaleseNew ZealanderNicaraguanNigerianNorthern EuropeanNorwegianOkinawanOsageOttawaPaiutePakistaniPalestinianPanamanianParaguayanPennsylvania GermanPeruvianPimaPolishPortuguesePotawatomiPuebloPuerto RicanPuget Sound SalishRomanianRussianSalvadoranSamoanScandinavianScotch-IrishScottishSeminoleSenegaleseSerbianShoshoneSierra LeoneanSiouxSlavicSlovakSloveneSomaliSouth AfricanSouth AmericanSouth American IndianSoviet UnionSpaniardSpanishSpanish AmericanSpanish American IndianSri LankanSubsaharan AfricanSudaneseSwedishSwissSyrianTaiwaneseThaiTlingit-HaidaTohono O'OdhamTonganTrinidadian and TobagonianTsimshianTurkishU.S. Virgin IslanderUgandanUkrainianUruguayanUteVenezuelanVietnameseWelshWest IndianYakamaYaquiYugoslavianYumanYup'ikZimbabwean
Immigration
NonimmigrantsImmigrantsAfghanistanAfricaAlbaniaArgentinaArmeniaAsiaAustraliaAustriaBahamasBangladeshBarbadosBelarusBelgiumBelizeBoliviaBosnia and HerzegovinaBrazilBulgariaBurma/MyanmarCabo VerdeCambodiaCameroonCanadaCaribbeanCentral AmericaChileChinaColombiaCongoCosta RicaCroatiaCubaCzechoslovakiaDenmarkDominicaDominican RepublicEastern AfricaEastern AsiaEastern EuropeEcuadorEgyptEl SalvadorEnglandEritreaEthiopiaEuropeFijiFranceGermanyGhanaGreeceGrenadaGuatemalaGuyanaHaitiHondurasHong KongHungaryIndiaIndonesiaIranIraqIrelandIsraelItalyJamaicaJapanJordanKazakhstanKenyaKoreaKuwaitLaosLatin AmericaLatviaLebanonLiberiaLithuaniaMalaysiaMexicoMicronesiaMiddle AfricaMoldovaMoroccoNepalNetherlandsNicaraguaNigeriaNorth AmericaNorth MacedoniaNorthern AfricaNorthern EuropeNorwayOceaniaPakistanPanamaPeruPhilippinesPolandPortugalRomaniaRussiaSaudi ArabiaScotlandSenegalSerbiaSierra LeoneSingaporeSomaliaSouth AfricaSouth AmericaSouth Central AsiaSouth Eastern AsiaSouthern EuropeSpainSri LankaSt. Vincent and the GrenadinesSudanSwedenSwitzerlandSyriaTaiwanThailandTrinidad and TobagoTurkeyUgandaUkraineUruguayUzbekistanVenezuelaVietnamWest IndiesWestern AfricaWestern AsiaWestern EuropeYemenZaireZimbabweAzores
Disability Age Under 5
Income
Poverty
Unemployment
Labor Participation
Family Structure
Vehicle Availability
Education Level
Disability

Disability Age Under 5 Comparison

Kiowa

Immigrants from Asia

Tragic
Exceptional
1.5%
DISABILITY AGE UNDER 5
0.0/ 100
METRIC RATING
278th/ 347
METRIC RANK
1.1%
DISABILITY AGE UNDER 5
99.8/ 100
METRIC RATING
44th/ 347
METRIC RANK

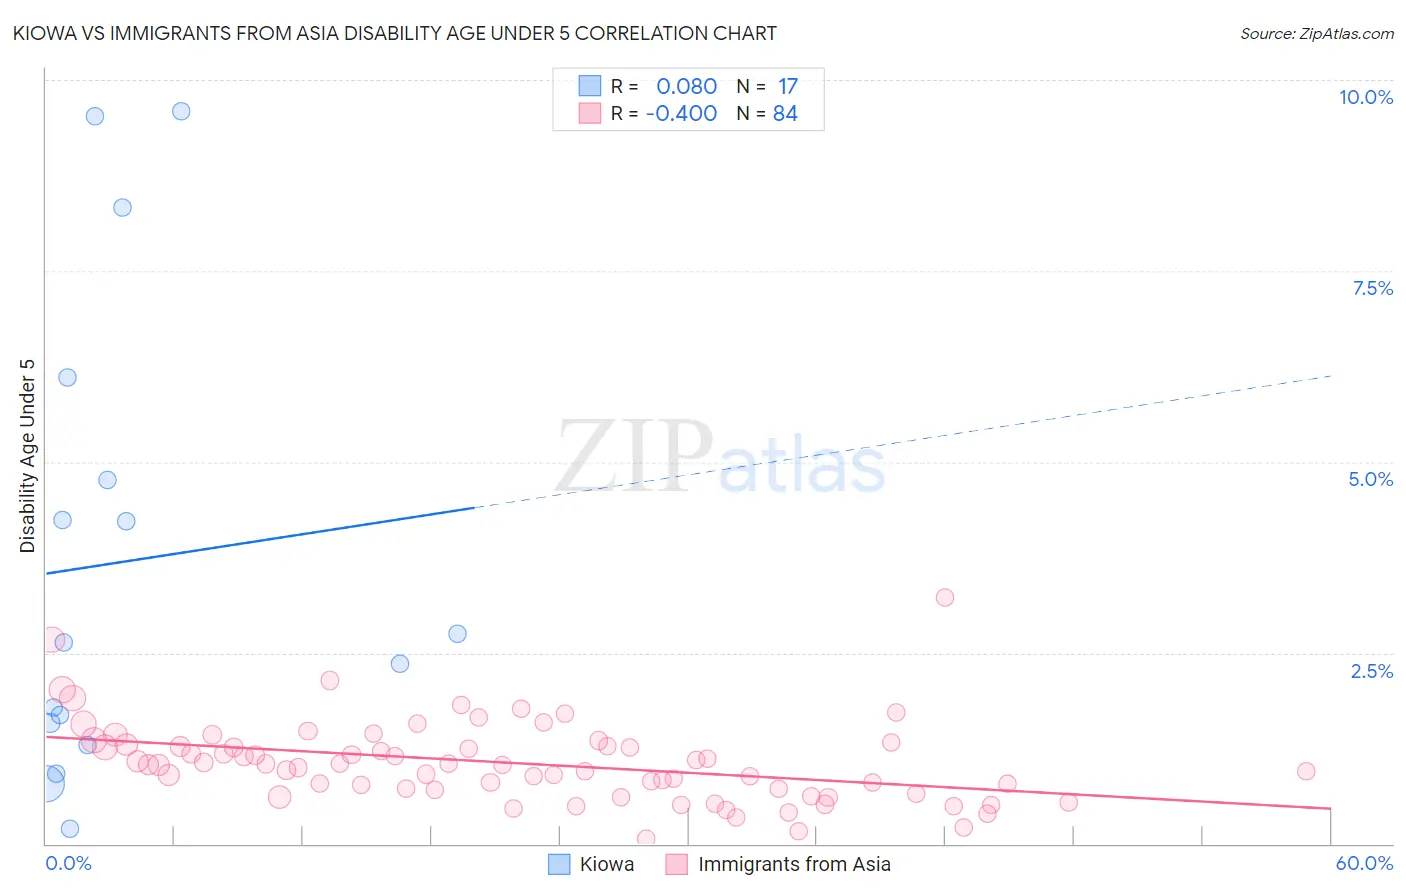
Kiowa vs Immigrants from Asia Disability Age Under 5 Correlation Chart

The statistical analysis conducted on geographies consisting of 48,964,732 people shows a slight positive correlation between the proportion of Kiowa and percentage of population with a disability under the age of 5 in the United States with a correlation coefficient (R) of 0.080 and weighted average of 1.5%. Similarly, the statistical analysis conducted on geographies consisting of 258,370,039 people shows a moderate negative correlation between the proportion of Immigrants from Asia and percentage of population with a disability under the age of 5 in the United States with a correlation coefficient (R) of -0.400 and weighted average of 1.1%, a difference of 38.9%.
Kiowa vs Immigrants from Asia Disability Age Under 5

Disability Age Under 5 Correlation Summary

MeasurementKiowaImmigrants from Asia
Minimum0.20%0.058%
Maximum9.6%3.2%
Range9.4%3.2%
Mean3.7%1.1%
Median2.6%1.0%
Interquartile 25% (IQ1)1.4%0.72%
Interquartile 75% (IQ3)5.4%1.3%
Interquartile Range (IQR)4.0%0.57%
Standard Deviation (Sample)3.0%0.53%
Standard Deviation (Population)2.9%0.53%

Similar Demographics by Disability Age Under 5

Demographics Similar to Kiowa by Disability Age Under 5

In terms of disability age under 5, the demographic groups most similar to Kiowa are Danish (1.5%, a difference of 0.010%), Canadian (1.5%, a difference of 0.080%), British (1.5%, a difference of 0.77%), Greek (1.5%, a difference of 0.78%), and Brazilian (1.5%, a difference of 1.4%).
DemographicsRating | RankDisability Age Under 5
Immigrants | Canada
0.1
/100
|
#271
Tragic
1.4%
Blacks/African Americans
0.1
/100
|
#272
Tragic
1.4%
Alaskan Athabascans
0.1
/100
|
#273
Tragic
1.5%
Iroquois
0.0
/100
|
#274
Tragic
1.5%
Brazilians
0.0
/100
|
#275
Tragic
1.5%
Greeks
0.0
/100
|
#276
Tragic
1.5%
Canadians
0.0
/100
|
#277
Tragic
1.5%
Kiowa
0.0
/100
|
#278
Tragic
1.5%
Danes
0.0
/100
|
#279
Tragic
1.5%
British
0.0
/100
|
#280
Tragic
1.5%
Czechoslovakians
0.0
/100
|
#281
Tragic
1.5%
Cheyenne
0.0
/100
|
#282
Tragic
1.5%
Delaware
0.0
/100
|
#283
Tragic
1.5%
Europeans
0.0
/100
|
#284
Tragic
1.5%
Croatians
0.0
/100
|
#285
Tragic
1.5%

Demographics Similar to Immigrants from Asia by Disability Age Under 5

In terms of disability age under 5, the demographic groups most similar to Immigrants from Asia are Pima (1.1%, a difference of 0.090%), Immigrants from Bulgaria (1.1%, a difference of 0.11%), Thai (1.1%, a difference of 0.21%), Immigrants from Turkey (1.1%, a difference of 0.22%), and Immigrants from Albania (1.1%, a difference of 0.61%).
DemographicsRating | RankDisability Age Under 5
Immigrants | India
99.9
/100
|
#37
Exceptional
1.0%
Immigrants | Guyana
99.9
/100
|
#38
Exceptional
1.0%
Filipinos
99.9
/100
|
#39
Exceptional
1.1%
Immigrants | Albania
99.9
/100
|
#40
Exceptional
1.1%
Thais
99.8
/100
|
#41
Exceptional
1.1%
Immigrants | Bulgaria
99.8
/100
|
#42
Exceptional
1.1%
Pima
99.8
/100
|
#43
Exceptional
1.1%
Immigrants | Asia
99.8
/100
|
#44
Exceptional
1.1%
Immigrants | Turkey
99.8
/100
|
#45
Exceptional
1.1%
Immigrants | Congo
99.8
/100
|
#46
Exceptional
1.1%
Immigrants | Sweden
99.8
/100
|
#47
Exceptional
1.1%
Immigrants | Singapore
99.7
/100
|
#48
Exceptional
1.1%
Immigrants | Russia
99.7
/100
|
#49
Exceptional
1.1%
Immigrants | Japan
99.7
/100
|
#50
Exceptional
1.1%
Immigrants | Kazakhstan
99.7
/100
|
#51
Exceptional
1.1%