Honduran vs Immigrants from Asia Disability Age Under 5
COMPARE
Honduran
Immigrants from Asia
Disability Age Under 5
Disability Age Under 5 Comparison
Hondurans
Immigrants from Asia
1.2%
DISABILITY AGE UNDER 5
72.5/ 100
METRIC RATING
152nd/ 347
METRIC RANK
1.1%
DISABILITY AGE UNDER 5
99.8/ 100
METRIC RATING
44th/ 347
METRIC RANK
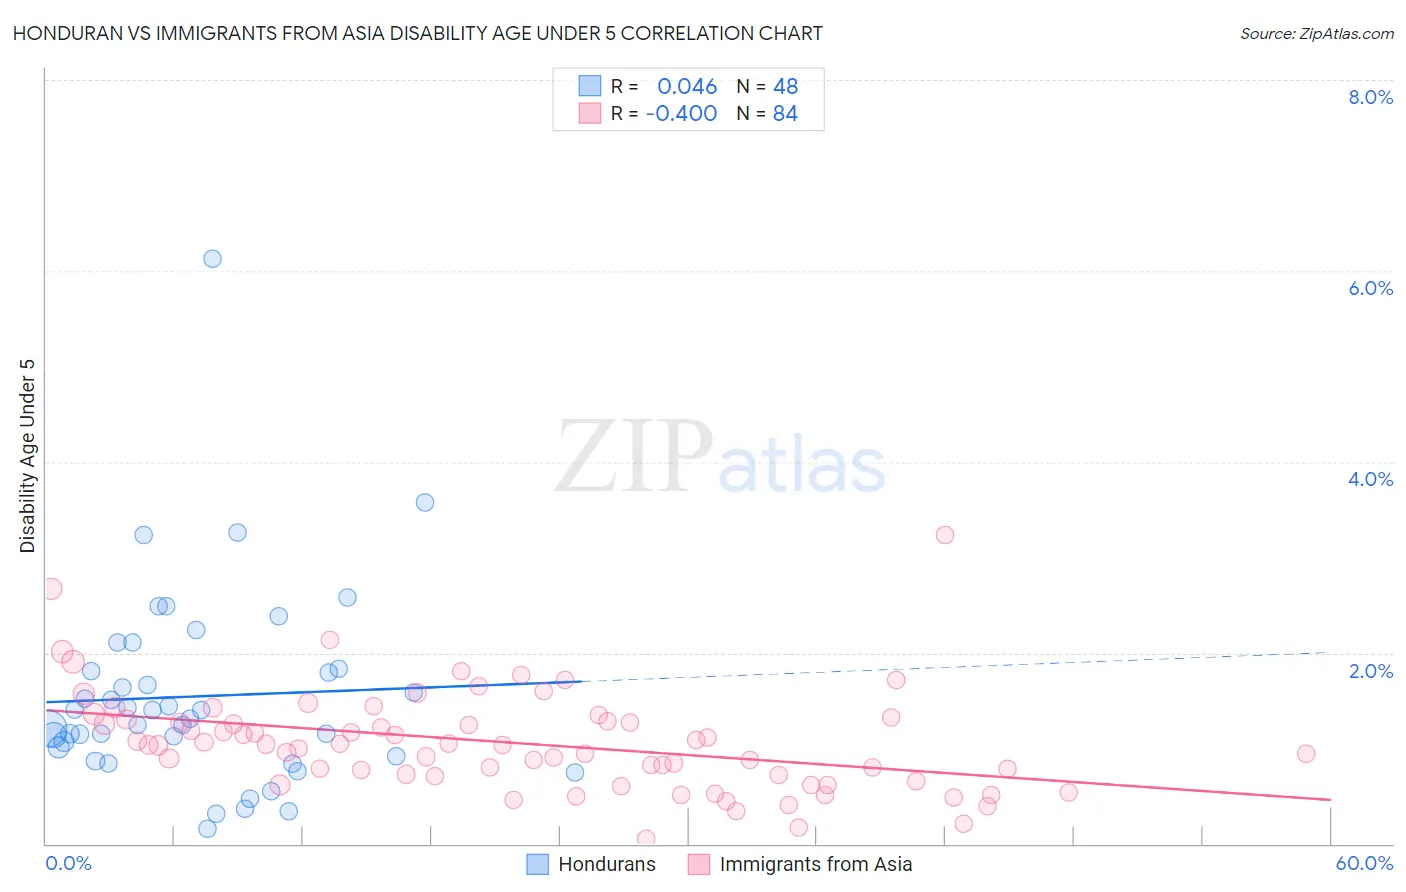
Honduran vs Immigrants from Asia Disability Age Under 5 Correlation Chart
The statistical analysis conducted on geographies consisting of 207,586,632 people shows no correlation between the proportion of Hondurans and percentage of population with a disability under the age of 5 in the United States with a correlation coefficient (R) of 0.046 and weighted average of 1.2%. Similarly, the statistical analysis conducted on geographies consisting of 258,370,039 people shows a moderate negative correlation between the proportion of Immigrants from Asia and percentage of population with a disability under the age of 5 in the United States with a correlation coefficient (R) of -0.400 and weighted average of 1.1%, a difference of 14.2%.
Disability Age Under 5 Correlation Summary
| Measurement | Honduran | Immigrants from Asia |
| Minimum | 0.16% | 0.058% |
| Maximum | 6.1% | 3.2% |
| Range | 6.0% | 3.2% |
| Mean | 1.5% | 1.1% |
| Median | 1.4% | 1.0% |
| Interquartile 25% (IQ1) | 0.96% | 0.72% |
| Interquartile 75% (IQ3) | 1.8% | 1.3% |
| Interquartile Range (IQR) | 0.86% | 0.57% |
| Standard Deviation (Sample) | 1.0% | 0.53% |
| Standard Deviation (Population) | 1.0% | 0.53% |
Similar Demographics by Disability Age Under 5
Demographics Similar to Hondurans by Disability Age Under 5
In terms of disability age under 5, the demographic groups most similar to Hondurans are Yaqui (1.2%, a difference of 0.28%), Immigrants from Thailand (1.2%, a difference of 0.34%), South American (1.2%, a difference of 0.38%), Uruguayan (1.2%, a difference of 0.41%), and Kenyan (1.2%, a difference of 0.42%).
| Demographics | Rating | Rank | Disability Age Under 5 |
| Immigrants | Zimbabwe | 77.9 /100 | #145 | Good 1.2% |
| Samoans | 77.7 /100 | #146 | Good 1.2% |
| Icelanders | 76.3 /100 | #147 | Good 1.2% |
| Ghanaians | 76.3 /100 | #148 | Good 1.2% |
| Kenyans | 75.9 /100 | #149 | Good 1.2% |
| South Americans | 75.6 /100 | #150 | Good 1.2% |
| Yaqui | 74.8 /100 | #151 | Good 1.2% |
| Hondurans | 72.5 /100 | #152 | Good 1.2% |
| Immigrants | Thailand | 69.4 /100 | #153 | Good 1.2% |
| Uruguayans | 68.8 /100 | #154 | Good 1.2% |
| Immigrants | Ghana | 68.7 /100 | #155 | Good 1.2% |
| Hawaiians | 68.5 /100 | #156 | Good 1.2% |
| Immigrants | South America | 67.0 /100 | #157 | Good 1.2% |
| Arabs | 66.4 /100 | #158 | Good 1.2% |
| Colombians | 65.8 /100 | #159 | Good 1.2% |
Demographics Similar to Immigrants from Asia by Disability Age Under 5
In terms of disability age under 5, the demographic groups most similar to Immigrants from Asia are Pima (1.1%, a difference of 0.090%), Immigrants from Bulgaria (1.1%, a difference of 0.11%), Thai (1.1%, a difference of 0.21%), Immigrants from Turkey (1.1%, a difference of 0.22%), and Immigrants from Albania (1.1%, a difference of 0.61%).
| Demographics | Rating | Rank | Disability Age Under 5 |
| Immigrants | India | 99.9 /100 | #37 | Exceptional 1.0% |
| Immigrants | Guyana | 99.9 /100 | #38 | Exceptional 1.0% |
| Filipinos | 99.9 /100 | #39 | Exceptional 1.1% |
| Immigrants | Albania | 99.9 /100 | #40 | Exceptional 1.1% |
| Thais | 99.8 /100 | #41 | Exceptional 1.1% |
| Immigrants | Bulgaria | 99.8 /100 | #42 | Exceptional 1.1% |
| Pima | 99.8 /100 | #43 | Exceptional 1.1% |
| Immigrants | Asia | 99.8 /100 | #44 | Exceptional 1.1% |
| Immigrants | Turkey | 99.8 /100 | #45 | Exceptional 1.1% |
| Immigrants | Congo | 99.8 /100 | #46 | Exceptional 1.1% |
| Immigrants | Sweden | 99.8 /100 | #47 | Exceptional 1.1% |
| Immigrants | Singapore | 99.7 /100 | #48 | Exceptional 1.1% |
| Immigrants | Russia | 99.7 /100 | #49 | Exceptional 1.1% |
| Immigrants | Japan | 99.7 /100 | #50 | Exceptional 1.1% |
| Immigrants | Kazakhstan | 99.7 /100 | #51 | Exceptional 1.1% |