Immigrants from Cameroon vs Soviet Union Disability Age 5 to 17
COMPARE
Immigrants from Cameroon
Soviet Union
Disability Age 5 to 17
Disability Age 5 to 17 Comparison
Immigrants from Cameroon
Soviet Union
5.8%
DISABILITY AGE 5 TO 17
8.3/ 100
METRIC RATING
213th/ 347
METRIC RANK
5.0%
DISABILITY AGE 5 TO 17
100.0/ 100
METRIC RATING
32nd/ 347
METRIC RANK
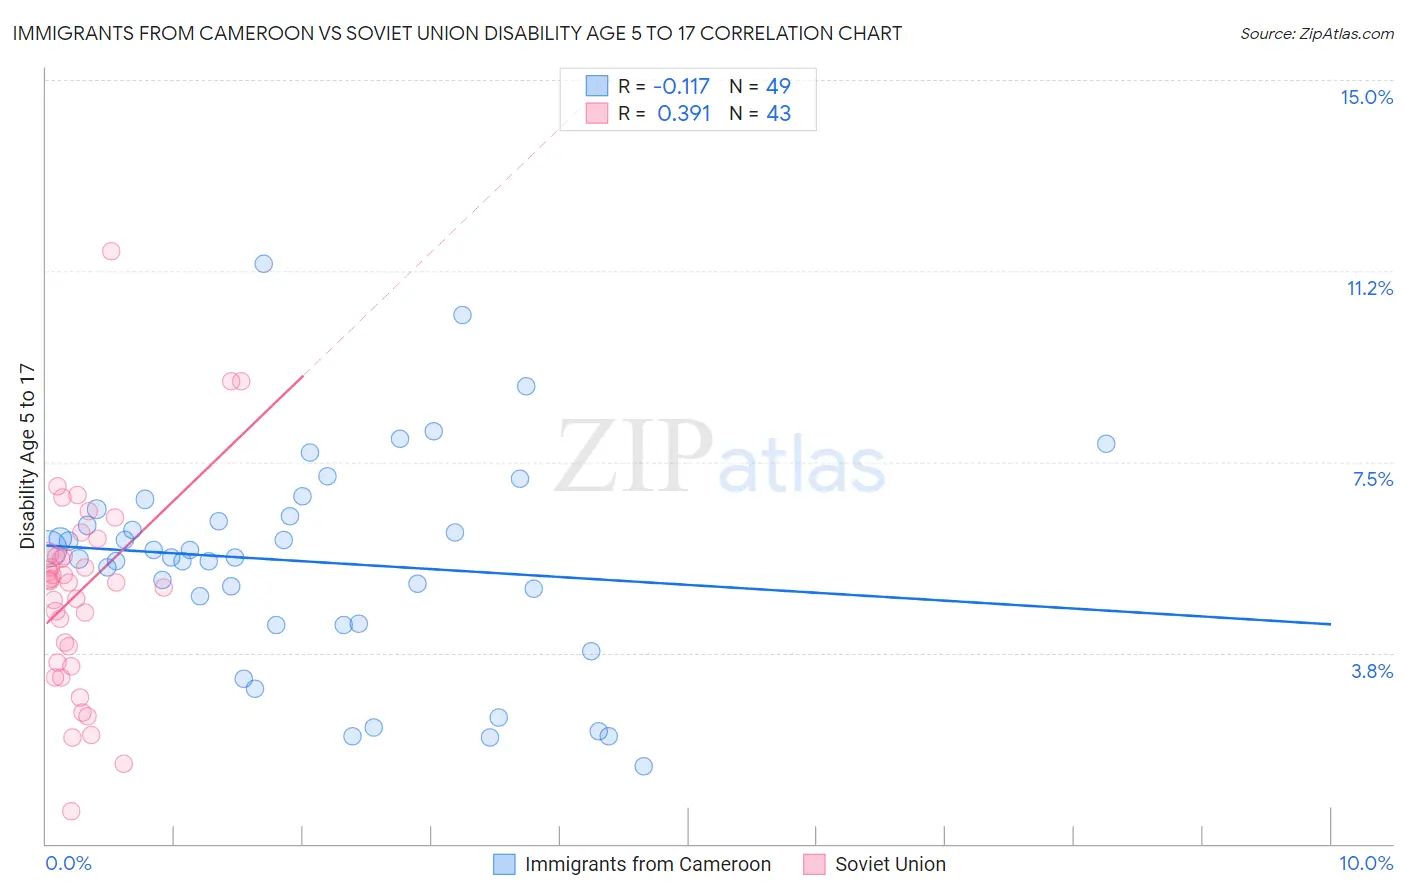
Immigrants from Cameroon vs Soviet Union Disability Age 5 to 17 Correlation Chart
The statistical analysis conducted on geographies consisting of 130,401,709 people shows a poor negative correlation between the proportion of Immigrants from Cameroon and percentage of population with a disability between the ages 5 and 17 in the United States with a correlation coefficient (R) of -0.117 and weighted average of 5.8%. Similarly, the statistical analysis conducted on geographies consisting of 43,434,016 people shows a mild positive correlation between the proportion of Soviet Union and percentage of population with a disability between the ages 5 and 17 in the United States with a correlation coefficient (R) of 0.391 and weighted average of 5.0%, a difference of 16.0%.
Disability Age 5 to 17 Correlation Summary
| Measurement | Immigrants from Cameroon | Soviet Union |
| Minimum | 1.5% | 0.64% |
| Maximum | 11.4% | 11.6% |
| Range | 9.9% | 11.0% |
| Mean | 5.5% | 5.0% |
| Median | 5.6% | 5.2% |
| Interquartile 25% (IQ1) | 4.3% | 3.6% |
| Interquartile 75% (IQ3) | 6.5% | 5.7% |
| Interquartile Range (IQR) | 2.2% | 2.1% |
| Standard Deviation (Sample) | 2.1% | 2.0% |
| Standard Deviation (Population) | 2.1% | 2.0% |
Similar Demographics by Disability Age 5 to 17
Demographics Similar to Immigrants from Cameroon by Disability Age 5 to 17
In terms of disability age 5 to 17, the demographic groups most similar to Immigrants from Cameroon are Immigrants from Morocco (5.8%, a difference of 0.0%), Swedish (5.8%, a difference of 0.040%), Immigrants from Panama (5.8%, a difference of 0.050%), Yugoslavian (5.8%, a difference of 0.12%), and Nigerian (5.8%, a difference of 0.13%).
| Demographics | Rating | Rank | Disability Age 5 to 17 |
| Immigrants | Africa | 10.8 /100 | #206 | Poor 5.7% |
| Moroccans | 10.4 /100 | #207 | Poor 5.7% |
| Kenyans | 10.0 /100 | #208 | Poor 5.8% |
| Immigrants | Uganda | 9.7 /100 | #209 | Tragic 5.8% |
| Immigrants | Haiti | 9.5 /100 | #210 | Tragic 5.8% |
| Yugoslavians | 9.1 /100 | #211 | Tragic 5.8% |
| Immigrants | Panama | 8.7 /100 | #212 | Tragic 5.8% |
| Immigrants | Cameroon | 8.3 /100 | #213 | Tragic 5.8% |
| Immigrants | Morocco | 8.3 /100 | #214 | Tragic 5.8% |
| Swedes | 8.1 /100 | #215 | Tragic 5.8% |
| Nigerians | 7.5 /100 | #216 | Tragic 5.8% |
| Czechs | 7.4 /100 | #217 | Tragic 5.8% |
| Immigrants | Sierra Leone | 7.1 /100 | #218 | Tragic 5.8% |
| Sierra Leoneans | 7.0 /100 | #219 | Tragic 5.8% |
| Belgians | 6.9 /100 | #220 | Tragic 5.8% |
Demographics Similar to Soviet Union by Disability Age 5 to 17
In terms of disability age 5 to 17, the demographic groups most similar to Soviet Union are Immigrants from Pakistan (5.0%, a difference of 0.040%), Immigrants from Malaysia (5.0%, a difference of 0.28%), Immigrants from Indonesia (5.0%, a difference of 0.32%), Israeli (5.0%, a difference of 0.44%), and Immigrants from Serbia (4.9%, a difference of 0.51%).
| Demographics | Rating | Rank | Disability Age 5 to 17 |
| Immigrants | Asia | 100.0 /100 | #25 | Exceptional 4.8% |
| Bhutanese | 100.0 /100 | #26 | Exceptional 4.9% |
| Taiwanese | 100.0 /100 | #27 | Exceptional 4.9% |
| Immigrants | Japan | 100.0 /100 | #28 | Exceptional 4.9% |
| Immigrants | Serbia | 100.0 /100 | #29 | Exceptional 4.9% |
| Immigrants | Malaysia | 100.0 /100 | #30 | Exceptional 5.0% |
| Immigrants | Pakistan | 100.0 /100 | #31 | Exceptional 5.0% |
| Soviet Union | 100.0 /100 | #32 | Exceptional 5.0% |
| Immigrants | Indonesia | 100.0 /100 | #33 | Exceptional 5.0% |
| Israelis | 100.0 /100 | #34 | Exceptional 5.0% |
| Bolivians | 100.0 /100 | #35 | Exceptional 5.0% |
| Immigrants | Egypt | 100.0 /100 | #36 | Exceptional 5.0% |
| Immigrants | Belarus | 100.0 /100 | #37 | Exceptional 5.0% |
| Immigrants | Philippines | 100.0 /100 | #38 | Exceptional 5.0% |
| Immigrants | Argentina | 100.0 /100 | #39 | Exceptional 5.0% |