Immigrants from Cambodia vs Albanian Disability
COMPARE
Immigrants from Cambodia
Albanian
Disability
Disability Comparison
Immigrants from Cambodia
Albanians
12.0%
DISABILITY
7.3/ 100
METRIC RATING
211th/ 347
METRIC RANK
11.7%
DISABILITY
50.0/ 100
METRIC RATING
174th/ 347
METRIC RANK
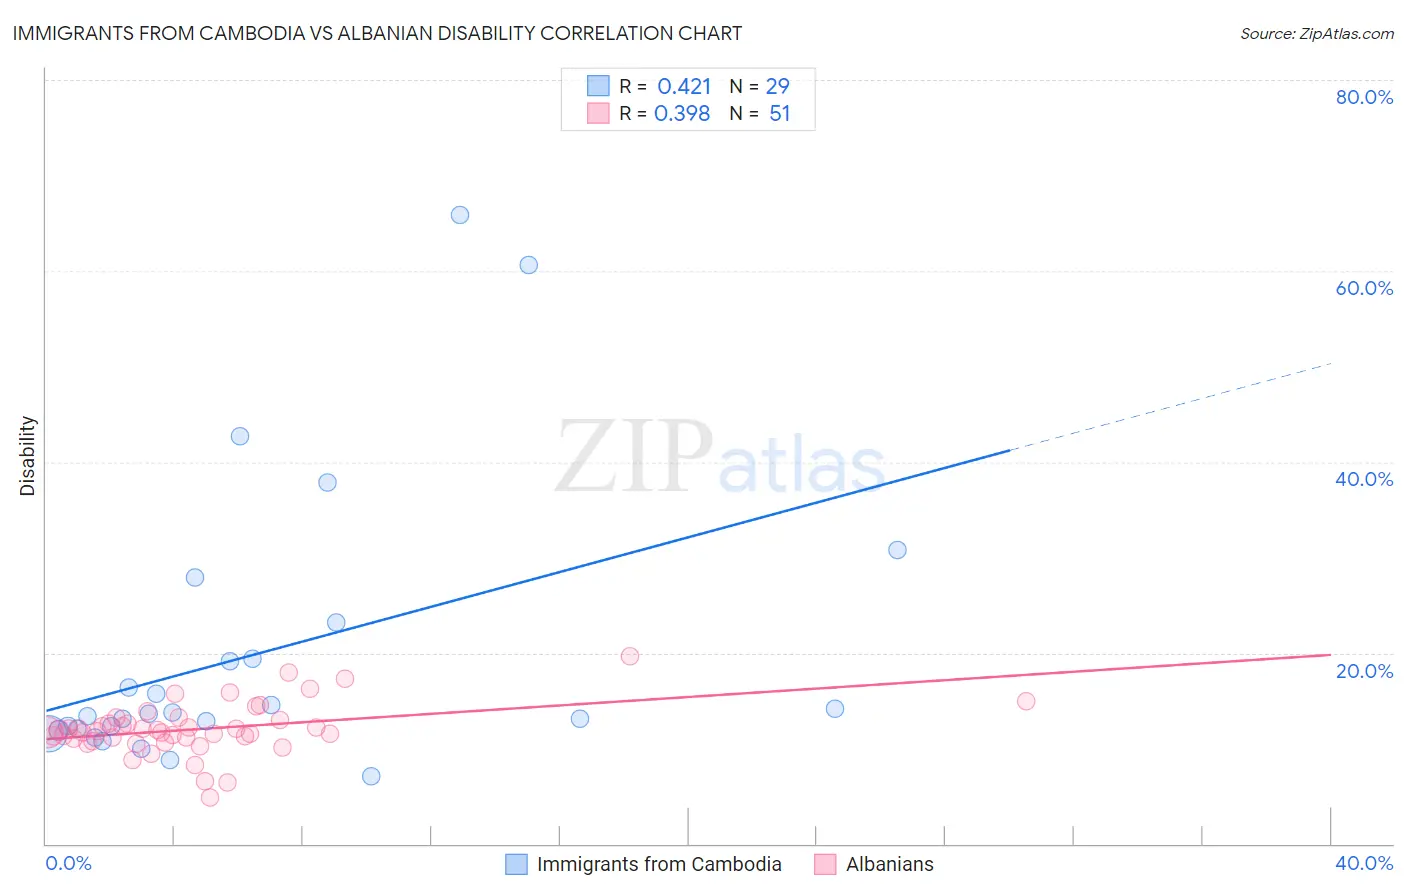
Immigrants from Cambodia vs Albanian Disability Correlation Chart
The statistical analysis conducted on geographies consisting of 205,156,443 people shows a moderate positive correlation between the proportion of Immigrants from Cambodia and percentage of population with a disability in the United States with a correlation coefficient (R) of 0.421 and weighted average of 12.0%. Similarly, the statistical analysis conducted on geographies consisting of 193,262,883 people shows a mild positive correlation between the proportion of Albanians and percentage of population with a disability in the United States with a correlation coefficient (R) of 0.398 and weighted average of 11.7%, a difference of 2.8%.
Disability Correlation Summary
| Measurement | Immigrants from Cambodia | Albanian |
| Minimum | 7.1% | 4.9% |
| Maximum | 65.9% | 19.7% |
| Range | 58.9% | 14.8% |
| Mean | 19.9% | 12.0% |
| Median | 13.6% | 11.7% |
| Interquartile 25% (IQ1) | 12.0% | 11.0% |
| Interquartile 75% (IQ3) | 21.2% | 12.9% |
| Interquartile Range (IQR) | 9.2% | 1.9% |
| Standard Deviation (Sample) | 14.7% | 2.7% |
| Standard Deviation (Population) | 14.4% | 2.7% |
Similar Demographics by Disability
Demographics Similar to Immigrants from Cambodia by Disability
In terms of disability, the demographic groups most similar to Immigrants from Cambodia are Austrian (12.0%, a difference of 0.030%), Immigrants from Iraq (12.0%, a difference of 0.030%), Czech (12.0%, a difference of 0.080%), Immigrants from Somalia (12.0%, a difference of 0.080%), and Danish (12.0%, a difference of 0.20%).
| Demographics | Rating | Rank | Disability |
| Mexican American Indians | 11.4 /100 | #204 | Poor 12.0% |
| Immigrants | Western Europe | 10.1 /100 | #205 | Poor 12.0% |
| Immigrants | Senegal | 9.4 /100 | #206 | Tragic 12.0% |
| Immigrants | Thailand | 9.3 /100 | #207 | Tragic 12.0% |
| Immigrants | Caribbean | 9.1 /100 | #208 | Tragic 12.0% |
| Danes | 8.7 /100 | #209 | Tragic 12.0% |
| Czechs | 7.9 /100 | #210 | Tragic 12.0% |
| Immigrants | Cambodia | 7.3 /100 | #211 | Tragic 12.0% |
| Austrians | 7.2 /100 | #212 | Tragic 12.0% |
| Immigrants | Iraq | 7.1 /100 | #213 | Tragic 12.0% |
| Immigrants | Somalia | 6.8 /100 | #214 | Tragic 12.0% |
| Immigrants | Canada | 6.1 /100 | #215 | Tragic 12.1% |
| Panamanians | 5.4 /100 | #216 | Tragic 12.1% |
| Immigrants | North America | 5.3 /100 | #217 | Tragic 12.1% |
| Immigrants | Jamaica | 5.0 /100 | #218 | Tragic 12.1% |
Demographics Similar to Albanians by Disability
In terms of disability, the demographic groups most similar to Albanians are Maltese (11.7%, a difference of 0.030%), Haitian (11.7%, a difference of 0.060%), Immigrants from Western Africa (11.7%, a difference of 0.11%), Immigrants from Albania (11.7%, a difference of 0.12%), and Immigrants from Southern Europe (11.7%, a difference of 0.12%).
| Demographics | Rating | Rank | Disability |
| Estonians | 54.4 /100 | #167 | Average 11.7% |
| Immigrants | Latin America | 54.1 /100 | #168 | Average 11.7% |
| Immigrants | Austria | 53.4 /100 | #169 | Average 11.7% |
| Immigrants | Albania | 52.8 /100 | #170 | Average 11.7% |
| Immigrants | Southern Europe | 52.8 /100 | #171 | Average 11.7% |
| Trinidadians and Tobagonians | 52.7 /100 | #172 | Average 11.7% |
| Maltese | 50.6 /100 | #173 | Average 11.7% |
| Albanians | 50.0 /100 | #174 | Average 11.7% |
| Haitians | 48.6 /100 | #175 | Average 11.7% |
| Immigrants | Western Africa | 47.5 /100 | #176 | Average 11.7% |
| Immigrants | Central America | 46.6 /100 | #177 | Average 11.7% |
| Greeks | 46.2 /100 | #178 | Average 11.7% |
| Immigrants | Armenia | 41.9 /100 | #179 | Average 11.7% |
| Immigrants | Honduras | 37.8 /100 | #180 | Fair 11.8% |
| Immigrants | Oceania | 34.3 /100 | #181 | Fair 11.8% |