Immigrants from Cambodia vs Slavic Disability
COMPARE
Immigrants from Cambodia
Slavic
Disability
Disability Comparison
Immigrants from Cambodia
Slavs
12.0%
DISABILITY
7.3/ 100
METRIC RATING
211th/ 347
METRIC RANK
12.4%
DISABILITY
0.5/ 100
METRIC RATING
258th/ 347
METRIC RANK
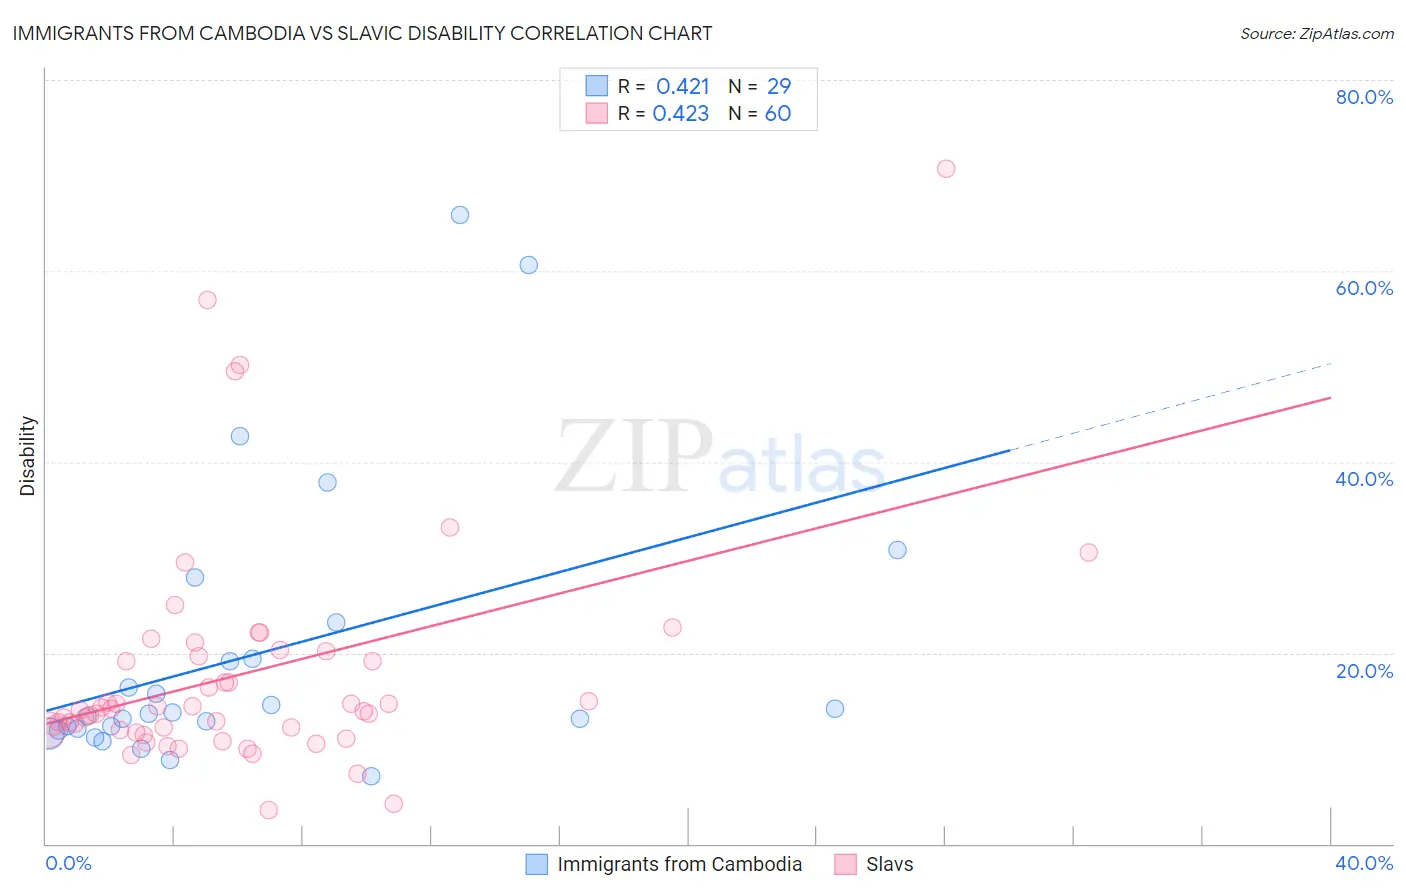
Immigrants from Cambodia vs Slavic Disability Correlation Chart
The statistical analysis conducted on geographies consisting of 205,156,443 people shows a moderate positive correlation between the proportion of Immigrants from Cambodia and percentage of population with a disability in the United States with a correlation coefficient (R) of 0.421 and weighted average of 12.0%. Similarly, the statistical analysis conducted on geographies consisting of 270,861,742 people shows a moderate positive correlation between the proportion of Slavs and percentage of population with a disability in the United States with a correlation coefficient (R) of 0.423 and weighted average of 12.4%, a difference of 3.1%.
Disability Correlation Summary
| Measurement | Immigrants from Cambodia | Slavic |
| Minimum | 7.1% | 3.5% |
| Maximum | 65.9% | 70.6% |
| Range | 58.9% | 67.1% |
| Mean | 19.9% | 17.8% |
| Median | 13.6% | 14.0% |
| Interquartile 25% (IQ1) | 12.0% | 11.9% |
| Interquartile 75% (IQ3) | 21.2% | 19.9% |
| Interquartile Range (IQR) | 9.2% | 7.9% |
| Standard Deviation (Sample) | 14.7% | 12.1% |
| Standard Deviation (Population) | 14.4% | 12.0% |
Similar Demographics by Disability
Demographics Similar to Immigrants from Cambodia by Disability
In terms of disability, the demographic groups most similar to Immigrants from Cambodia are Austrian (12.0%, a difference of 0.030%), Immigrants from Iraq (12.0%, a difference of 0.030%), Czech (12.0%, a difference of 0.080%), Immigrants from Somalia (12.0%, a difference of 0.080%), and Danish (12.0%, a difference of 0.20%).
| Demographics | Rating | Rank | Disability |
| Mexican American Indians | 11.4 /100 | #204 | Poor 12.0% |
| Immigrants | Western Europe | 10.1 /100 | #205 | Poor 12.0% |
| Immigrants | Senegal | 9.4 /100 | #206 | Tragic 12.0% |
| Immigrants | Thailand | 9.3 /100 | #207 | Tragic 12.0% |
| Immigrants | Caribbean | 9.1 /100 | #208 | Tragic 12.0% |
| Danes | 8.7 /100 | #209 | Tragic 12.0% |
| Czechs | 7.9 /100 | #210 | Tragic 12.0% |
| Immigrants | Cambodia | 7.3 /100 | #211 | Tragic 12.0% |
| Austrians | 7.2 /100 | #212 | Tragic 12.0% |
| Immigrants | Iraq | 7.1 /100 | #213 | Tragic 12.0% |
| Immigrants | Somalia | 6.8 /100 | #214 | Tragic 12.0% |
| Immigrants | Canada | 6.1 /100 | #215 | Tragic 12.1% |
| Panamanians | 5.4 /100 | #216 | Tragic 12.1% |
| Immigrants | North America | 5.3 /100 | #217 | Tragic 12.1% |
| Immigrants | Jamaica | 5.0 /100 | #218 | Tragic 12.1% |
Demographics Similar to Slavs by Disability
In terms of disability, the demographic groups most similar to Slavs are Canadian (12.4%, a difference of 0.060%), Immigrants from Liberia (12.4%, a difference of 0.090%), Immigrants from Laos (12.4%, a difference of 0.14%), Scandinavian (12.4%, a difference of 0.16%), and Immigrants from Dominica (12.4%, a difference of 0.23%).
| Demographics | Rating | Rank | Disability |
| Europeans | 1.4 /100 | #251 | Tragic 12.3% |
| Bermudans | 1.1 /100 | #252 | Tragic 12.3% |
| Belgians | 0.8 /100 | #253 | Tragic 12.3% |
| German Russians | 0.8 /100 | #254 | Tragic 12.3% |
| Slovenes | 0.6 /100 | #255 | Tragic 12.4% |
| Immigrants | Dominica | 0.6 /100 | #256 | Tragic 12.4% |
| Immigrants | Laos | 0.5 /100 | #257 | Tragic 12.4% |
| Slavs | 0.5 /100 | #258 | Tragic 12.4% |
| Canadians | 0.4 /100 | #259 | Tragic 12.4% |
| Immigrants | Liberia | 0.4 /100 | #260 | Tragic 12.4% |
| Scandinavians | 0.4 /100 | #261 | Tragic 12.4% |
| Native Hawaiians | 0.3 /100 | #262 | Tragic 12.5% |
| Hawaiians | 0.2 /100 | #263 | Tragic 12.5% |
| Immigrants | Germany | 0.2 /100 | #264 | Tragic 12.5% |
| U.S. Virgin Islanders | 0.2 /100 | #265 | Tragic 12.5% |