Immigrants from Cambodia vs Immigrants from Hungary Disability
COMPARE
Immigrants from Cambodia
Immigrants from Hungary
Disability
Disability Comparison
Immigrants from Cambodia
Immigrants from Hungary
12.0%
DISABILITY
7.3/ 100
METRIC RATING
211th/ 347
METRIC RANK
11.5%
DISABILITY
79.0/ 100
METRIC RATING
146th/ 347
METRIC RANK
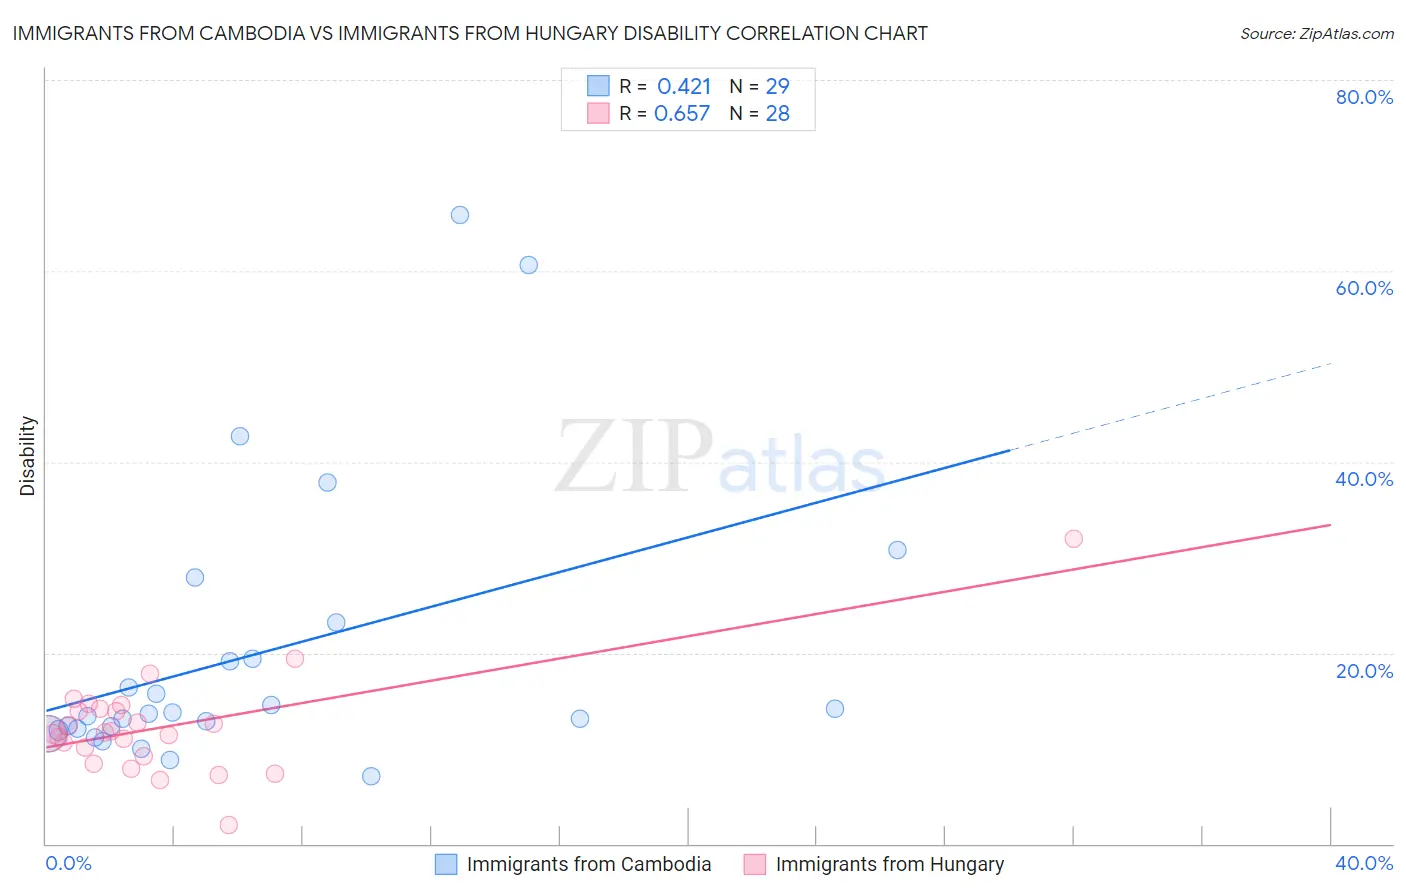
Immigrants from Cambodia vs Immigrants from Hungary Disability Correlation Chart
The statistical analysis conducted on geographies consisting of 205,156,443 people shows a moderate positive correlation between the proportion of Immigrants from Cambodia and percentage of population with a disability in the United States with a correlation coefficient (R) of 0.421 and weighted average of 12.0%. Similarly, the statistical analysis conducted on geographies consisting of 195,708,395 people shows a significant positive correlation between the proportion of Immigrants from Hungary and percentage of population with a disability in the United States with a correlation coefficient (R) of 0.657 and weighted average of 11.5%, a difference of 4.3%.
Disability Correlation Summary
| Measurement | Immigrants from Cambodia | Immigrants from Hungary |
| Minimum | 7.1% | 2.0% |
| Maximum | 65.9% | 32.0% |
| Range | 58.9% | 30.0% |
| Mean | 19.9% | 12.2% |
| Median | 13.6% | 11.6% |
| Interquartile 25% (IQ1) | 12.0% | 9.6% |
| Interquartile 75% (IQ3) | 21.2% | 14.0% |
| Interquartile Range (IQR) | 9.2% | 4.4% |
| Standard Deviation (Sample) | 14.7% | 5.2% |
| Standard Deviation (Population) | 14.4% | 5.1% |
Similar Demographics by Disability
Demographics Similar to Immigrants from Cambodia by Disability
In terms of disability, the demographic groups most similar to Immigrants from Cambodia are Austrian (12.0%, a difference of 0.030%), Immigrants from Iraq (12.0%, a difference of 0.030%), Czech (12.0%, a difference of 0.080%), Immigrants from Somalia (12.0%, a difference of 0.080%), and Danish (12.0%, a difference of 0.20%).
| Demographics | Rating | Rank | Disability |
| Mexican American Indians | 11.4 /100 | #204 | Poor 12.0% |
| Immigrants | Western Europe | 10.1 /100 | #205 | Poor 12.0% |
| Immigrants | Senegal | 9.4 /100 | #206 | Tragic 12.0% |
| Immigrants | Thailand | 9.3 /100 | #207 | Tragic 12.0% |
| Immigrants | Caribbean | 9.1 /100 | #208 | Tragic 12.0% |
| Danes | 8.7 /100 | #209 | Tragic 12.0% |
| Czechs | 7.9 /100 | #210 | Tragic 12.0% |
| Immigrants | Cambodia | 7.3 /100 | #211 | Tragic 12.0% |
| Austrians | 7.2 /100 | #212 | Tragic 12.0% |
| Immigrants | Iraq | 7.1 /100 | #213 | Tragic 12.0% |
| Immigrants | Somalia | 6.8 /100 | #214 | Tragic 12.0% |
| Immigrants | Canada | 6.1 /100 | #215 | Tragic 12.1% |
| Panamanians | 5.4 /100 | #216 | Tragic 12.1% |
| Immigrants | North America | 5.3 /100 | #217 | Tragic 12.1% |
| Immigrants | Jamaica | 5.0 /100 | #218 | Tragic 12.1% |
Demographics Similar to Immigrants from Hungary by Disability
In terms of disability, the demographic groups most similar to Immigrants from Hungary are Immigrants from Ukraine (11.5%, a difference of 0.090%), Sudanese (11.5%, a difference of 0.12%), Nigerian (11.5%, a difference of 0.16%), Australian (11.5%, a difference of 0.25%), and Moroccan (11.5%, a difference of 0.32%).
| Demographics | Rating | Rank | Disability |
| Ghanaians | 87.0 /100 | #139 | Excellent 11.5% |
| Russians | 86.8 /100 | #140 | Excellent 11.5% |
| Immigrants | Grenada | 86.1 /100 | #141 | Excellent 11.5% |
| Immigrants | Sudan | 85.3 /100 | #142 | Excellent 11.5% |
| Moroccans | 83.3 /100 | #143 | Excellent 11.5% |
| Australians | 82.5 /100 | #144 | Excellent 11.5% |
| Nigerians | 81.3 /100 | #145 | Excellent 11.5% |
| Immigrants | Hungary | 79.0 /100 | #146 | Good 11.5% |
| Immigrants | Ukraine | 77.6 /100 | #147 | Good 11.5% |
| Sudanese | 77.1 /100 | #148 | Good 11.5% |
| Immigrants | Norway | 73.2 /100 | #149 | Good 11.6% |
| Romanians | 72.7 /100 | #150 | Good 11.6% |
| Immigrants | Kenya | 72.1 /100 | #151 | Good 11.6% |
| Immigrants | Moldova | 72.0 /100 | #152 | Good 11.6% |
| Immigrants | Ghana | 71.2 /100 | #153 | Good 11.6% |