Immigrants from Cambodia vs Finnish Disability
COMPARE
Immigrants from Cambodia
Finnish
Disability
Disability Comparison
Immigrants from Cambodia
Finns
12.0%
DISABILITY
7.3/ 100
METRIC RATING
211th/ 347
METRIC RANK
12.7%
DISABILITY
0.0/ 100
METRIC RATING
273rd/ 347
METRIC RANK
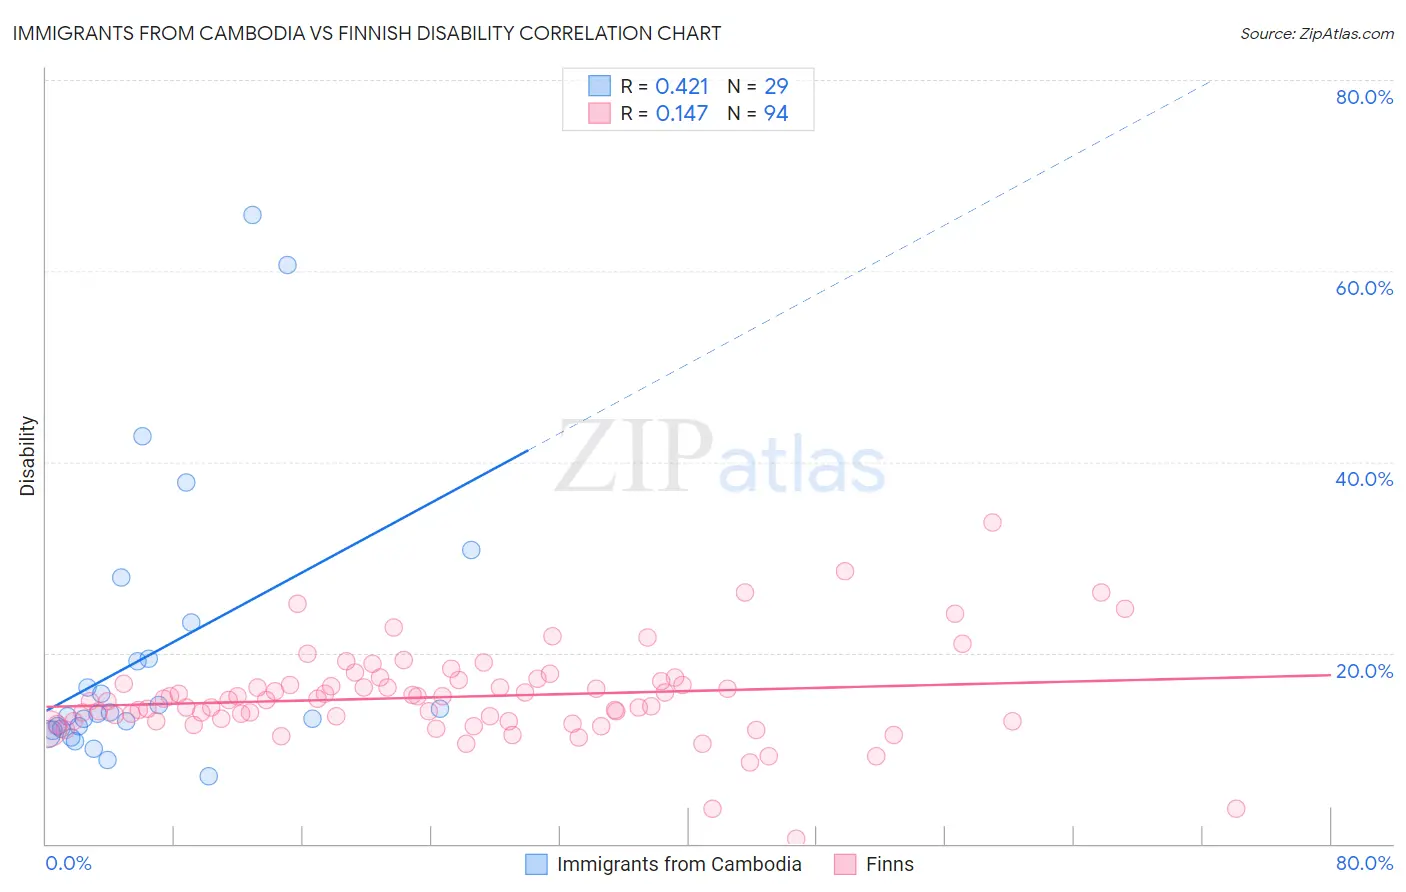
Immigrants from Cambodia vs Finnish Disability Correlation Chart
The statistical analysis conducted on geographies consisting of 205,156,443 people shows a moderate positive correlation between the proportion of Immigrants from Cambodia and percentage of population with a disability in the United States with a correlation coefficient (R) of 0.421 and weighted average of 12.0%. Similarly, the statistical analysis conducted on geographies consisting of 404,645,748 people shows a poor positive correlation between the proportion of Finns and percentage of population with a disability in the United States with a correlation coefficient (R) of 0.147 and weighted average of 12.7%, a difference of 5.7%.
Disability Correlation Summary
| Measurement | Immigrants from Cambodia | Finnish |
| Minimum | 7.1% | 0.58% |
| Maximum | 65.9% | 33.6% |
| Range | 58.9% | 33.1% |
| Mean | 19.9% | 15.4% |
| Median | 13.6% | 15.1% |
| Interquartile 25% (IQ1) | 12.0% | 12.8% |
| Interquartile 75% (IQ3) | 21.2% | 17.0% |
| Interquartile Range (IQR) | 9.2% | 4.2% |
| Standard Deviation (Sample) | 14.7% | 4.8% |
| Standard Deviation (Population) | 14.4% | 4.8% |
Similar Demographics by Disability
Demographics Similar to Immigrants from Cambodia by Disability
In terms of disability, the demographic groups most similar to Immigrants from Cambodia are Austrian (12.0%, a difference of 0.030%), Immigrants from Iraq (12.0%, a difference of 0.030%), Czech (12.0%, a difference of 0.080%), Immigrants from Somalia (12.0%, a difference of 0.080%), and Danish (12.0%, a difference of 0.20%).
| Demographics | Rating | Rank | Disability |
| Mexican American Indians | 11.4 /100 | #204 | Poor 12.0% |
| Immigrants | Western Europe | 10.1 /100 | #205 | Poor 12.0% |
| Immigrants | Senegal | 9.4 /100 | #206 | Tragic 12.0% |
| Immigrants | Thailand | 9.3 /100 | #207 | Tragic 12.0% |
| Immigrants | Caribbean | 9.1 /100 | #208 | Tragic 12.0% |
| Danes | 8.7 /100 | #209 | Tragic 12.0% |
| Czechs | 7.9 /100 | #210 | Tragic 12.0% |
| Immigrants | Cambodia | 7.3 /100 | #211 | Tragic 12.0% |
| Austrians | 7.2 /100 | #212 | Tragic 12.0% |
| Immigrants | Iraq | 7.1 /100 | #213 | Tragic 12.0% |
| Immigrants | Somalia | 6.8 /100 | #214 | Tragic 12.0% |
| Immigrants | Canada | 6.1 /100 | #215 | Tragic 12.1% |
| Panamanians | 5.4 /100 | #216 | Tragic 12.1% |
| Immigrants | North America | 5.3 /100 | #217 | Tragic 12.1% |
| Immigrants | Jamaica | 5.0 /100 | #218 | Tragic 12.1% |
Demographics Similar to Finns by Disability
In terms of disability, the demographic groups most similar to Finns are Dominican (12.7%, a difference of 0.16%), Nepalese (12.8%, a difference of 0.43%), Sioux (12.8%, a difference of 0.51%), Immigrants from Yemen (12.6%, a difference of 0.66%), and Hmong (12.8%, a difference of 0.67%).
| Demographics | Rating | Rank | Disability |
| Czechoslovakians | 0.2 /100 | #266 | Tragic 12.5% |
| Spaniards | 0.2 /100 | #267 | Tragic 12.5% |
| Bangladeshis | 0.1 /100 | #268 | Tragic 12.6% |
| Immigrants | Dominican Republic | 0.1 /100 | #269 | Tragic 12.6% |
| Portuguese | 0.1 /100 | #270 | Tragic 12.6% |
| Immigrants | Yemen | 0.1 /100 | #271 | Tragic 12.6% |
| Dominicans | 0.0 /100 | #272 | Tragic 12.7% |
| Finns | 0.0 /100 | #273 | Tragic 12.7% |
| Nepalese | 0.0 /100 | #274 | Tragic 12.8% |
| Sioux | 0.0 /100 | #275 | Tragic 12.8% |
| Hmong | 0.0 /100 | #276 | Tragic 12.8% |
| Dutch | 0.0 /100 | #277 | Tragic 12.8% |
| Germans | 0.0 /100 | #278 | Tragic 12.8% |
| Fijians | 0.0 /100 | #279 | Tragic 12.8% |
| Spanish | 0.0 /100 | #280 | Tragic 12.8% |