Immigrants from Cambodia vs Immigrants from Pakistan Female Disability
COMPARE
Immigrants from Cambodia
Immigrants from Pakistan
Female Disability
Female Disability Comparison
Immigrants from Cambodia
Immigrants from Pakistan
12.5%
FEMALE DISABILITY
7.8/ 100
METRIC RATING
228th/ 347
METRIC RANK
10.9%
FEMALE DISABILITY
100.0/ 100
METRIC RATING
20th/ 347
METRIC RANK
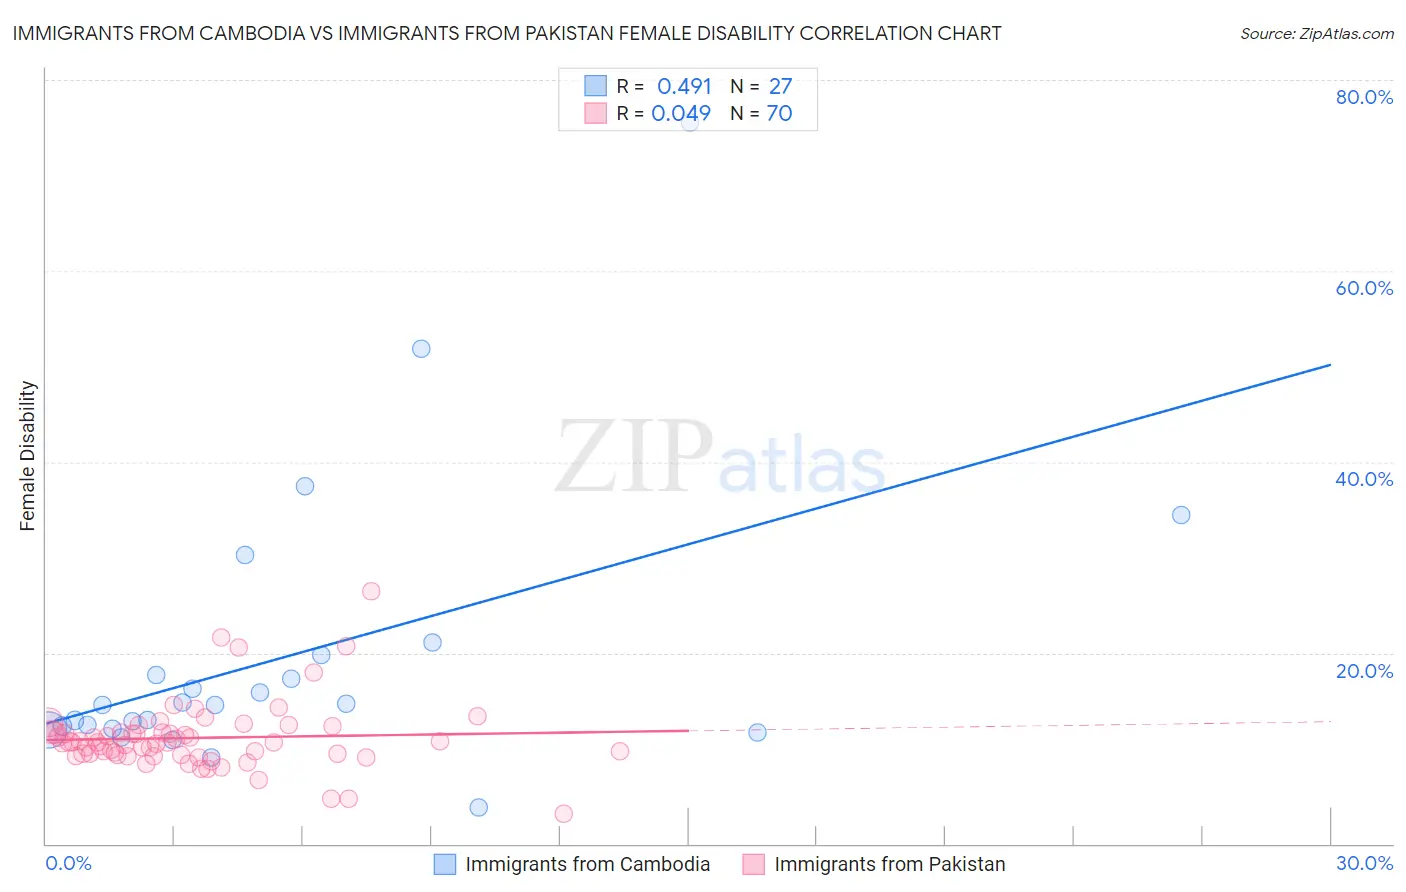
Immigrants from Cambodia vs Immigrants from Pakistan Female Disability Correlation Chart
The statistical analysis conducted on geographies consisting of 205,152,256 people shows a moderate positive correlation between the proportion of Immigrants from Cambodia and percentage of females with a disability in the United States with a correlation coefficient (R) of 0.491 and weighted average of 12.5%. Similarly, the statistical analysis conducted on geographies consisting of 283,889,302 people shows no correlation between the proportion of Immigrants from Pakistan and percentage of females with a disability in the United States with a correlation coefficient (R) of 0.049 and weighted average of 10.9%, a difference of 14.8%.
Female Disability Correlation Summary
| Measurement | Immigrants from Cambodia | Immigrants from Pakistan |
| Minimum | 3.8% | 3.1% |
| Maximum | 75.5% | 26.5% |
| Range | 71.7% | 23.3% |
| Mean | 19.6% | 11.1% |
| Median | 14.5% | 10.6% |
| Interquartile 25% (IQ1) | 12.0% | 9.3% |
| Interquartile 75% (IQ3) | 19.8% | 11.7% |
| Interquartile Range (IQR) | 7.8% | 2.3% |
| Standard Deviation (Sample) | 15.0% | 3.6% |
| Standard Deviation (Population) | 14.8% | 3.6% |
Similar Demographics by Female Disability
Demographics Similar to Immigrants from Cambodia by Female Disability
In terms of female disability, the demographic groups most similar to Immigrants from Cambodia are Hispanic or Latino (12.5%, a difference of 0.030%), Assyrian/Chaldean/Syriac (12.5%, a difference of 0.030%), Hungarian (12.5%, a difference of 0.070%), Polish (12.5%, a difference of 0.080%), and Immigrants from Belize (12.5%, a difference of 0.11%).
| Demographics | Rating | Rank | Female Disability |
| Native Hawaiians | 10.8 /100 | #221 | Poor 12.4% |
| Italians | 10.7 /100 | #222 | Poor 12.4% |
| Guamanians/Chamorros | 9.5 /100 | #223 | Tragic 12.5% |
| Belizeans | 9.3 /100 | #224 | Tragic 12.5% |
| Poles | 8.4 /100 | #225 | Tragic 12.5% |
| Hispanics or Latinos | 8.0 /100 | #226 | Tragic 12.5% |
| Assyrians/Chaldeans/Syriacs | 8.0 /100 | #227 | Tragic 12.5% |
| Immigrants | Cambodia | 7.8 /100 | #228 | Tragic 12.5% |
| Hungarians | 7.2 /100 | #229 | Tragic 12.5% |
| Immigrants | Belize | 7.0 /100 | #230 | Tragic 12.5% |
| Belgians | 6.5 /100 | #231 | Tragic 12.5% |
| Immigrants | Somalia | 5.9 /100 | #232 | Tragic 12.5% |
| Immigrants | Iraq | 5.3 /100 | #233 | Tragic 12.5% |
| Scandinavians | 5.3 /100 | #234 | Tragic 12.5% |
| Malaysians | 5.0 /100 | #235 | Tragic 12.5% |
Demographics Similar to Immigrants from Pakistan by Female Disability
In terms of female disability, the demographic groups most similar to Immigrants from Pakistan are Immigrants from Venezuela (10.9%, a difference of 0.17%), Asian (10.9%, a difference of 0.36%), Immigrants from Iran (10.8%, a difference of 0.39%), Immigrants from Sri Lanka (10.9%, a difference of 0.49%), and Venezuelan (11.0%, a difference of 0.71%).
| Demographics | Rating | Rank | Female Disability |
| Immigrants | Eastern Asia | 100.0 /100 | #13 | Exceptional 10.7% |
| Immigrants | China | 100.0 /100 | #14 | Exceptional 10.7% |
| Burmese | 100.0 /100 | #15 | Exceptional 10.7% |
| Okinawans | 100.0 /100 | #16 | Exceptional 10.8% |
| Indians (Asian) | 100.0 /100 | #17 | Exceptional 10.8% |
| Immigrants | Iran | 100.0 /100 | #18 | Exceptional 10.8% |
| Immigrants | Venezuela | 100.0 /100 | #19 | Exceptional 10.9% |
| Immigrants | Pakistan | 100.0 /100 | #20 | Exceptional 10.9% |
| Asians | 100.0 /100 | #21 | Exceptional 10.9% |
| Immigrants | Sri Lanka | 100.0 /100 | #22 | Exceptional 10.9% |
| Venezuelans | 100.0 /100 | #23 | Exceptional 11.0% |
| Immigrants | Argentina | 100.0 /100 | #24 | Exceptional 11.0% |
| Immigrants | Asia | 100.0 /100 | #25 | Exceptional 11.0% |
| Argentineans | 100.0 /100 | #26 | Exceptional 11.0% |
| Immigrants | Turkey | 100.0 /100 | #27 | Exceptional 11.1% |