Immigrants from England vs Zimbabwean Hearing Disability
COMPARE
Immigrants from England
Zimbabwean
Hearing Disability
Hearing Disability Comparison
Immigrants from England
Zimbabweans
3.3%
HEARING DISABILITY
0.7/ 100
METRIC RATING
246th/ 347
METRIC RANK
2.8%
HEARING DISABILITY
89.9/ 100
METRIC RATING
118th/ 347
METRIC RANK
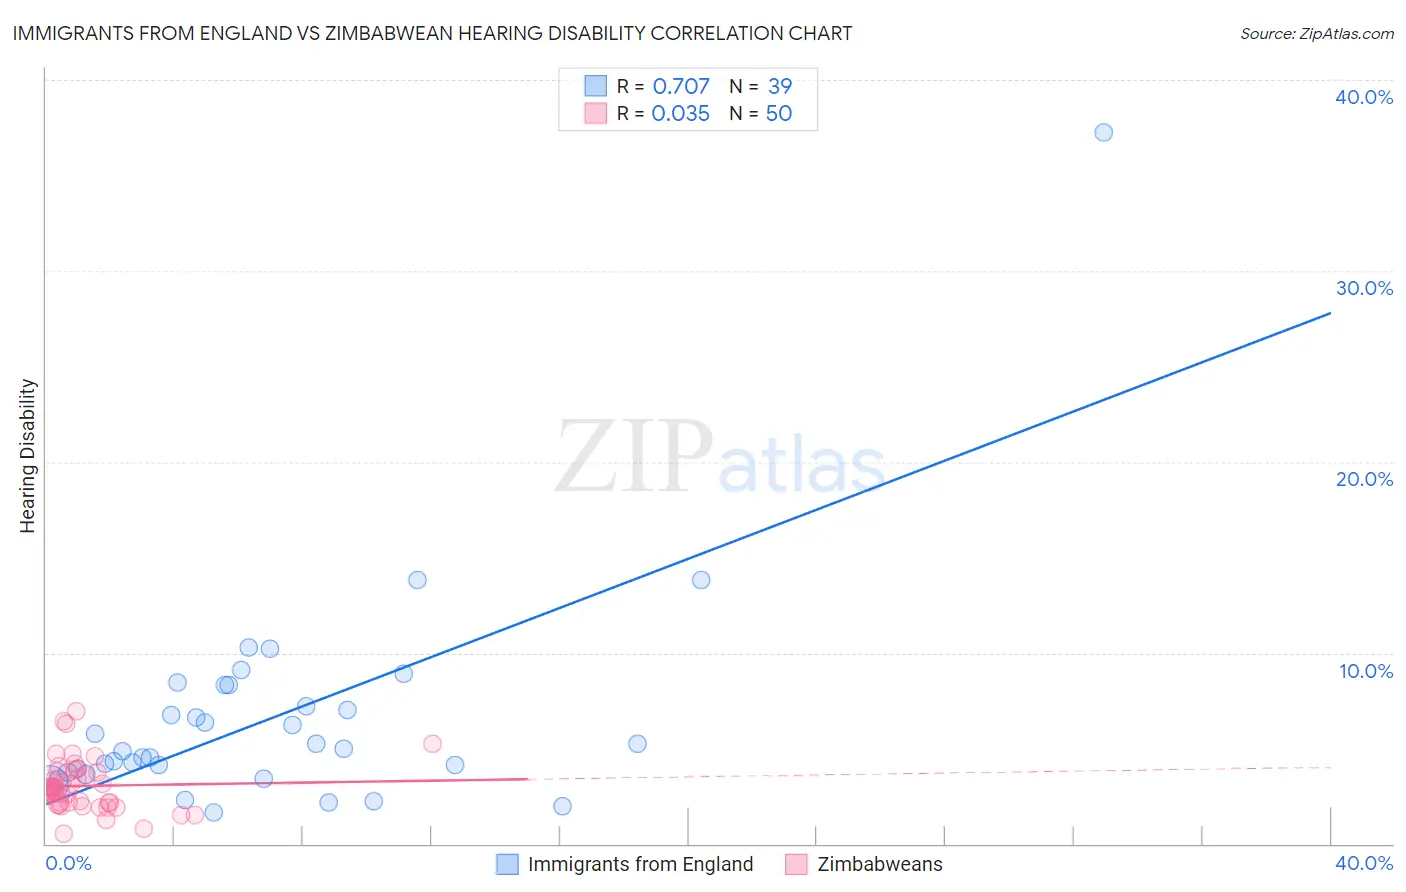
Immigrants from England vs Zimbabwean Hearing Disability Correlation Chart
The statistical analysis conducted on geographies consisting of 391,804,752 people shows a strong positive correlation between the proportion of Immigrants from England and percentage of population with hearing disability in the United States with a correlation coefficient (R) of 0.707 and weighted average of 3.3%. Similarly, the statistical analysis conducted on geographies consisting of 69,200,821 people shows no correlation between the proportion of Zimbabweans and percentage of population with hearing disability in the United States with a correlation coefficient (R) of 0.035 and weighted average of 2.8%, a difference of 17.7%.
Hearing Disability Correlation Summary
| Measurement | Immigrants from England | Zimbabwean |
| Minimum | 1.6% | 0.53% |
| Maximum | 37.3% | 6.9% |
| Range | 35.7% | 6.4% |
| Mean | 6.6% | 3.0% |
| Median | 5.0% | 2.9% |
| Interquartile 25% (IQ1) | 3.8% | 2.1% |
| Interquartile 75% (IQ3) | 8.3% | 3.7% |
| Interquartile Range (IQR) | 4.5% | 1.6% |
| Standard Deviation (Sample) | 5.9% | 1.3% |
| Standard Deviation (Population) | 5.8% | 1.3% |
Similar Demographics by Hearing Disability
Demographics Similar to Immigrants from England by Hearing Disability
In terms of hearing disability, the demographic groups most similar to Immigrants from England are Lithuanian (3.4%, a difference of 0.20%), Immigrants from Scotland (3.3%, a difference of 0.28%), Austrian (3.4%, a difference of 0.42%), Assyrian/Chaldean/Syriac (3.3%, a difference of 0.62%), and Immigrants from Western Europe (3.3%, a difference of 0.69%).
| Demographics | Rating | Rank | Hearing Disability |
| Nepalese | 1.2 /100 | #239 | Tragic 3.3% |
| Immigrants | Netherlands | 1.1 /100 | #240 | Tragic 3.3% |
| Samoans | 1.1 /100 | #241 | Tragic 3.3% |
| Yugoslavians | 1.0 /100 | #242 | Tragic 3.3% |
| Immigrants | Western Europe | 1.0 /100 | #243 | Tragic 3.3% |
| Assyrians/Chaldeans/Syriacs | 0.9 /100 | #244 | Tragic 3.3% |
| Immigrants | Scotland | 0.8 /100 | #245 | Tragic 3.3% |
| Immigrants | England | 0.7 /100 | #246 | Tragic 3.3% |
| Lithuanians | 0.6 /100 | #247 | Tragic 3.4% |
| Austrians | 0.6 /100 | #248 | Tragic 3.4% |
| Italians | 0.4 /100 | #249 | Tragic 3.4% |
| Yuman | 0.4 /100 | #250 | Tragic 3.4% |
| Hungarians | 0.4 /100 | #251 | Tragic 3.4% |
| Croatians | 0.4 /100 | #252 | Tragic 3.4% |
| Carpatho Rusyns | 0.3 /100 | #253 | Tragic 3.4% |
Demographics Similar to Zimbabweans by Hearing Disability
In terms of hearing disability, the demographic groups most similar to Zimbabweans are Immigrants from Liberia (2.8%, a difference of 0.010%), Kenyan (2.8%, a difference of 0.020%), Immigrants (2.8%, a difference of 0.10%), Jordanian (2.8%, a difference of 0.11%), and Cuban (2.8%, a difference of 0.14%).
| Demographics | Rating | Rank | Hearing Disability |
| Immigrants | Yemen | 92.7 /100 | #111 | Exceptional 2.8% |
| U.S. Virgin Islanders | 92.5 /100 | #112 | Exceptional 2.8% |
| Immigrants | Belarus | 91.6 /100 | #113 | Exceptional 2.8% |
| Cambodians | 91.1 /100 | #114 | Exceptional 2.8% |
| Immigrants | Latin America | 90.5 /100 | #115 | Exceptional 2.8% |
| Immigrants | Immigrants | 90.3 /100 | #116 | Exceptional 2.8% |
| Immigrants | Liberia | 90.0 /100 | #117 | Excellent 2.8% |
| Zimbabweans | 89.9 /100 | #118 | Excellent 2.8% |
| Kenyans | 89.8 /100 | #119 | Excellent 2.8% |
| Jordanians | 89.5 /100 | #120 | Excellent 2.8% |
| Cubans | 89.4 /100 | #121 | Excellent 2.8% |
| Liberians | 89.0 /100 | #122 | Excellent 2.8% |
| Immigrants | Zaire | 88.6 /100 | #123 | Excellent 2.9% |
| Bahamians | 88.6 /100 | #124 | Excellent 2.9% |
| Immigrants | Albania | 88.5 /100 | #125 | Excellent 2.9% |