Immigrants from Burma/Myanmar vs Tsimshian Ambulatory Disability
COMPARE
Immigrants from Burma/Myanmar
Tsimshian
Ambulatory Disability
Ambulatory Disability Comparison
Immigrants from Burma/Myanmar
Tsimshian
6.1%
AMBULATORY DISABILITY
52.2/ 100
METRIC RATING
172nd/ 347
METRIC RANK
8.8%
AMBULATORY DISABILITY
0.0/ 100
METRIC RATING
344th/ 347
METRIC RANK
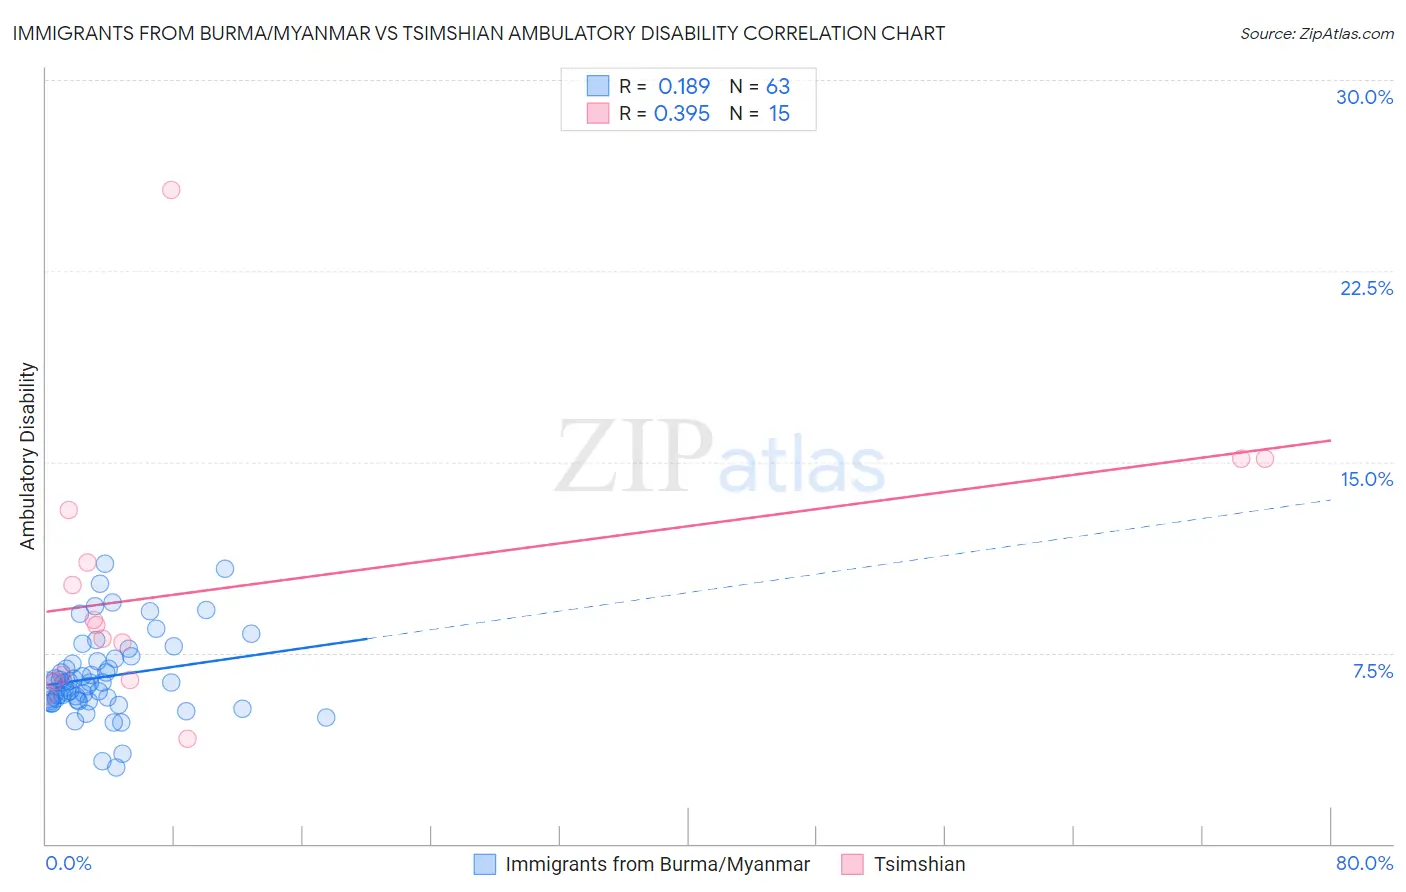
Immigrants from Burma/Myanmar vs Tsimshian Ambulatory Disability Correlation Chart
The statistical analysis conducted on geographies consisting of 172,292,594 people shows a poor positive correlation between the proportion of Immigrants from Burma/Myanmar and percentage of population with ambulatory disability in the United States with a correlation coefficient (R) of 0.189 and weighted average of 6.1%. Similarly, the statistical analysis conducted on geographies consisting of 15,626,544 people shows a mild positive correlation between the proportion of Tsimshian and percentage of population with ambulatory disability in the United States with a correlation coefficient (R) of 0.395 and weighted average of 8.8%, a difference of 44.3%.
Ambulatory Disability Correlation Summary
| Measurement | Immigrants from Burma/Myanmar | Tsimshian |
| Minimum | 3.0% | 4.1% |
| Maximum | 11.0% | 25.7% |
| Range | 8.0% | 21.5% |
| Mean | 6.6% | 10.2% |
| Median | 6.3% | 8.6% |
| Interquartile 25% (IQ1) | 5.6% | 6.5% |
| Interquartile 75% (IQ3) | 7.3% | 13.1% |
| Interquartile Range (IQR) | 1.7% | 6.6% |
| Standard Deviation (Sample) | 1.6% | 5.4% |
| Standard Deviation (Population) | 1.6% | 5.2% |
Similar Demographics by Ambulatory Disability
Demographics Similar to Immigrants from Burma/Myanmar by Ambulatory Disability
In terms of ambulatory disability, the demographic groups most similar to Immigrants from Burma/Myanmar are Moroccan (6.1%, a difference of 0.020%), Croatian (6.1%, a difference of 0.050%), Immigrants from Ecuador (6.1%, a difference of 0.090%), Immigrants from Canada (6.1%, a difference of 0.11%), and Vietnamese (6.1%, a difference of 0.26%).
| Demographics | Rating | Rank | Ambulatory Disability |
| Nicaraguans | 63.2 /100 | #165 | Good 6.1% |
| Iraqis | 62.8 /100 | #166 | Good 6.1% |
| Immigrants | Oceania | 60.7 /100 | #167 | Good 6.1% |
| Ecuadorians | 60.5 /100 | #168 | Good 6.1% |
| Immigrants | Southern Europe | 58.1 /100 | #169 | Average 6.1% |
| Immigrants | Ecuador | 53.8 /100 | #170 | Average 6.1% |
| Moroccans | 52.6 /100 | #171 | Average 6.1% |
| Immigrants | Burma/Myanmar | 52.2 /100 | #172 | Average 6.1% |
| Croatians | 51.2 /100 | #173 | Average 6.1% |
| Immigrants | Canada | 50.0 /100 | #174 | Average 6.1% |
| Vietnamese | 47.2 /100 | #175 | Average 6.1% |
| Immigrants | North America | 45.6 /100 | #176 | Average 6.1% |
| Immigrants | England | 45.4 /100 | #177 | Average 6.1% |
| Scandinavians | 44.5 /100 | #178 | Average 6.1% |
| Austrians | 44.1 /100 | #179 | Average 6.1% |
Demographics Similar to Tsimshian by Ambulatory Disability
In terms of ambulatory disability, the demographic groups most similar to Tsimshian are Puerto Rican (8.9%, a difference of 0.59%), Tohono O'odham (8.7%, a difference of 0.97%), Kiowa (8.6%, a difference of 2.5%), Creek (8.5%, a difference of 4.4%), and Houma (9.3%, a difference of 5.5%).
| Demographics | Rating | Rank | Ambulatory Disability |
| Cherokee | 0.0 /100 | #333 | Tragic 7.9% |
| Yuman | 0.0 /100 | #334 | Tragic 7.9% |
| Chickasaw | 0.0 /100 | #335 | Tragic 8.0% |
| Seminole | 0.0 /100 | #336 | Tragic 8.0% |
| Dutch West Indians | 0.0 /100 | #337 | Tragic 8.2% |
| Colville | 0.0 /100 | #338 | Tragic 8.2% |
| Pima | 0.0 /100 | #339 | Tragic 8.2% |
| Choctaw | 0.0 /100 | #340 | Tragic 8.3% |
| Creek | 0.0 /100 | #341 | Tragic 8.5% |
| Kiowa | 0.0 /100 | #342 | Tragic 8.6% |
| Tohono O'odham | 0.0 /100 | #343 | Tragic 8.7% |
| Tsimshian | 0.0 /100 | #344 | Tragic 8.8% |
| Puerto Ricans | 0.0 /100 | #345 | Tragic 8.9% |
| Houma | 0.0 /100 | #346 | Tragic 9.3% |
| Lumbee | 0.0 /100 | #347 | Tragic 9.5% |