Immigrants from Burma/Myanmar vs Russian Ambulatory Disability
COMPARE
Immigrants from Burma/Myanmar
Russian
Ambulatory Disability
Ambulatory Disability Comparison
Immigrants from Burma/Myanmar
Russians
6.1%
AMBULATORY DISABILITY
52.2/ 100
METRIC RATING
172nd/ 347
METRIC RANK
5.9%
AMBULATORY DISABILITY
93.4/ 100
METRIC RATING
118th/ 347
METRIC RANK
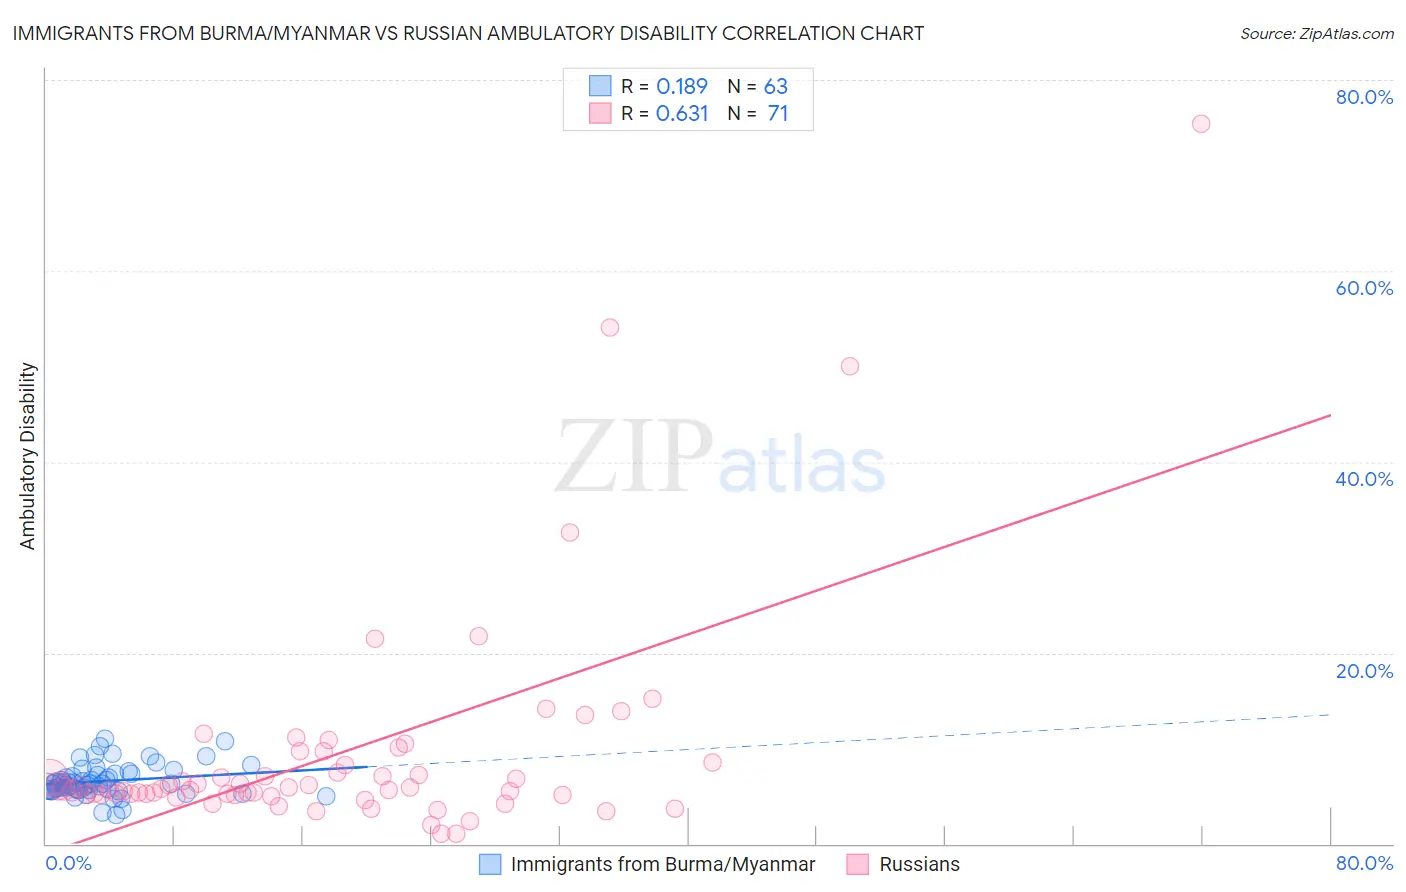
Immigrants from Burma/Myanmar vs Russian Ambulatory Disability Correlation Chart
The statistical analysis conducted on geographies consisting of 172,292,594 people shows a poor positive correlation between the proportion of Immigrants from Burma/Myanmar and percentage of population with ambulatory disability in the United States with a correlation coefficient (R) of 0.189 and weighted average of 6.1%. Similarly, the statistical analysis conducted on geographies consisting of 511,917,360 people shows a significant positive correlation between the proportion of Russians and percentage of population with ambulatory disability in the United States with a correlation coefficient (R) of 0.631 and weighted average of 5.9%, a difference of 3.5%.
Ambulatory Disability Correlation Summary
| Measurement | Immigrants from Burma/Myanmar | Russian |
| Minimum | 3.0% | 1.0% |
| Maximum | 11.0% | 75.4% |
| Range | 8.0% | 74.4% |
| Mean | 6.6% | 9.5% |
| Median | 6.3% | 5.8% |
| Interquartile 25% (IQ1) | 5.6% | 5.2% |
| Interquartile 75% (IQ3) | 7.3% | 8.5% |
| Interquartile Range (IQR) | 1.7% | 3.3% |
| Standard Deviation (Sample) | 1.6% | 11.9% |
| Standard Deviation (Population) | 1.6% | 11.9% |
Similar Demographics by Ambulatory Disability
Demographics Similar to Immigrants from Burma/Myanmar by Ambulatory Disability
In terms of ambulatory disability, the demographic groups most similar to Immigrants from Burma/Myanmar are Moroccan (6.1%, a difference of 0.020%), Croatian (6.1%, a difference of 0.050%), Immigrants from Ecuador (6.1%, a difference of 0.090%), Immigrants from Canada (6.1%, a difference of 0.11%), and Vietnamese (6.1%, a difference of 0.26%).
| Demographics | Rating | Rank | Ambulatory Disability |
| Nicaraguans | 63.2 /100 | #165 | Good 6.1% |
| Iraqis | 62.8 /100 | #166 | Good 6.1% |
| Immigrants | Oceania | 60.7 /100 | #167 | Good 6.1% |
| Ecuadorians | 60.5 /100 | #168 | Good 6.1% |
| Immigrants | Southern Europe | 58.1 /100 | #169 | Average 6.1% |
| Immigrants | Ecuador | 53.8 /100 | #170 | Average 6.1% |
| Moroccans | 52.6 /100 | #171 | Average 6.1% |
| Immigrants | Burma/Myanmar | 52.2 /100 | #172 | Average 6.1% |
| Croatians | 51.2 /100 | #173 | Average 6.1% |
| Immigrants | Canada | 50.0 /100 | #174 | Average 6.1% |
| Vietnamese | 47.2 /100 | #175 | Average 6.1% |
| Immigrants | North America | 45.6 /100 | #176 | Average 6.1% |
| Immigrants | England | 45.4 /100 | #177 | Average 6.1% |
| Scandinavians | 44.5 /100 | #178 | Average 6.1% |
| Austrians | 44.1 /100 | #179 | Average 6.1% |
Demographics Similar to Russians by Ambulatory Disability
In terms of ambulatory disability, the demographic groups most similar to Russians are Immigrants from South Eastern Asia (5.9%, a difference of 0.040%), Norwegian (5.9%, a difference of 0.080%), Estonian (5.9%, a difference of 0.11%), Costa Rican (5.9%, a difference of 0.18%), and Icelander (5.9%, a difference of 0.18%).
| Demographics | Rating | Rank | Ambulatory Disability |
| Danes | 96.6 /100 | #111 | Exceptional 5.8% |
| South Africans | 96.3 /100 | #112 | Exceptional 5.9% |
| Immigrants | Uruguay | 95.6 /100 | #113 | Exceptional 5.9% |
| Immigrants | Poland | 95.4 /100 | #114 | Exceptional 5.9% |
| South American Indians | 94.8 /100 | #115 | Exceptional 5.9% |
| Immigrants | Africa | 94.7 /100 | #116 | Exceptional 5.9% |
| Immigrants | South Eastern Asia | 93.6 /100 | #117 | Exceptional 5.9% |
| Russians | 93.4 /100 | #118 | Exceptional 5.9% |
| Norwegians | 93.1 /100 | #119 | Exceptional 5.9% |
| Estonians | 92.9 /100 | #120 | Exceptional 5.9% |
| Costa Ricans | 92.6 /100 | #121 | Exceptional 5.9% |
| Icelanders | 92.6 /100 | #122 | Exceptional 5.9% |
| Immigrants | Russia | 92.4 /100 | #123 | Exceptional 5.9% |
| Immigrants | Middle Africa | 92.2 /100 | #124 | Exceptional 5.9% |
| Koreans | 91.6 /100 | #125 | Exceptional 5.9% |