Immigrants from Germany vs Tsimshian Ambulatory Disability
COMPARE
Immigrants from Germany
Tsimshian
Ambulatory Disability
Ambulatory Disability Comparison
Immigrants from Germany
Tsimshian
6.4%
AMBULATORY DISABILITY
1.8/ 100
METRIC RATING
237th/ 347
METRIC RANK
8.8%
AMBULATORY DISABILITY
0.0/ 100
METRIC RATING
344th/ 347
METRIC RANK
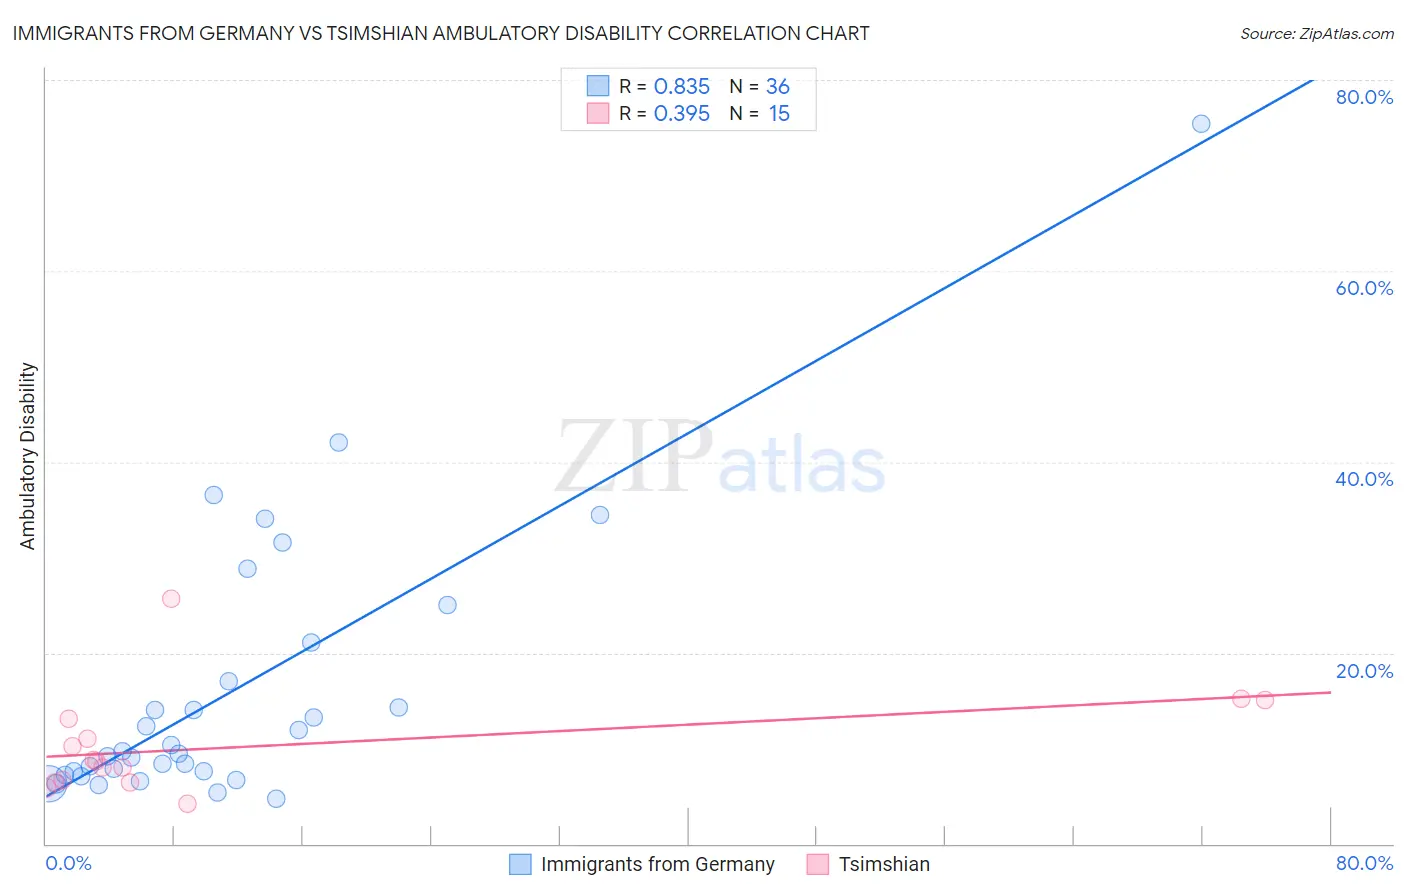
Immigrants from Germany vs Tsimshian Ambulatory Disability Correlation Chart
The statistical analysis conducted on geographies consisting of 463,770,128 people shows a very strong positive correlation between the proportion of Immigrants from Germany and percentage of population with ambulatory disability in the United States with a correlation coefficient (R) of 0.835 and weighted average of 6.4%. Similarly, the statistical analysis conducted on geographies consisting of 15,626,544 people shows a mild positive correlation between the proportion of Tsimshian and percentage of population with ambulatory disability in the United States with a correlation coefficient (R) of 0.395 and weighted average of 8.8%, a difference of 37.0%.
Ambulatory Disability Correlation Summary
| Measurement | Immigrants from Germany | Tsimshian |
| Minimum | 4.7% | 4.1% |
| Maximum | 75.4% | 25.7% |
| Range | 70.7% | 21.5% |
| Mean | 16.1% | 10.2% |
| Median | 9.6% | 8.6% |
| Interquartile 25% (IQ1) | 7.4% | 6.5% |
| Interquartile 75% (IQ3) | 19.0% | 13.1% |
| Interquartile Range (IQR) | 11.6% | 6.6% |
| Standard Deviation (Sample) | 14.5% | 5.4% |
| Standard Deviation (Population) | 14.3% | 5.2% |
Similar Demographics by Ambulatory Disability
Demographics Similar to Immigrants from Germany by Ambulatory Disability
In terms of ambulatory disability, the demographic groups most similar to Immigrants from Germany are Haitian (6.4%, a difference of 0.010%), Senegalese (6.4%, a difference of 0.080%), Dutch (6.4%, a difference of 0.090%), Immigrants from Senegal (6.4%, a difference of 0.10%), and Immigrants from Haiti (6.5%, a difference of 0.19%).
| Demographics | Rating | Rank | Ambulatory Disability |
| Mexicans | 3.5 /100 | #230 | Tragic 6.4% |
| Panamanians | 3.1 /100 | #231 | Tragic 6.4% |
| Assyrians/Chaldeans/Syriacs | 2.4 /100 | #232 | Tragic 6.4% |
| Sub-Saharan Africans | 2.3 /100 | #233 | Tragic 6.4% |
| Immigrants | Liberia | 2.3 /100 | #234 | Tragic 6.4% |
| Hispanics or Latinos | 2.2 /100 | #235 | Tragic 6.4% |
| Dutch | 2.0 /100 | #236 | Tragic 6.4% |
| Immigrants | Germany | 1.8 /100 | #237 | Tragic 6.4% |
| Haitians | 1.8 /100 | #238 | Tragic 6.4% |
| Senegalese | 1.7 /100 | #239 | Tragic 6.4% |
| Immigrants | Senegal | 1.7 /100 | #240 | Tragic 6.4% |
| Immigrants | Haiti | 1.6 /100 | #241 | Tragic 6.5% |
| Spaniards | 1.6 /100 | #242 | Tragic 6.5% |
| Germans | 1.5 /100 | #243 | Tragic 6.5% |
| Immigrants | Panama | 1.5 /100 | #244 | Tragic 6.5% |
Demographics Similar to Tsimshian by Ambulatory Disability
In terms of ambulatory disability, the demographic groups most similar to Tsimshian are Puerto Rican (8.9%, a difference of 0.59%), Tohono O'odham (8.7%, a difference of 0.97%), Kiowa (8.6%, a difference of 2.5%), Creek (8.5%, a difference of 4.4%), and Houma (9.3%, a difference of 5.5%).
| Demographics | Rating | Rank | Ambulatory Disability |
| Cherokee | 0.0 /100 | #333 | Tragic 7.9% |
| Yuman | 0.0 /100 | #334 | Tragic 7.9% |
| Chickasaw | 0.0 /100 | #335 | Tragic 8.0% |
| Seminole | 0.0 /100 | #336 | Tragic 8.0% |
| Dutch West Indians | 0.0 /100 | #337 | Tragic 8.2% |
| Colville | 0.0 /100 | #338 | Tragic 8.2% |
| Pima | 0.0 /100 | #339 | Tragic 8.2% |
| Choctaw | 0.0 /100 | #340 | Tragic 8.3% |
| Creek | 0.0 /100 | #341 | Tragic 8.5% |
| Kiowa | 0.0 /100 | #342 | Tragic 8.6% |
| Tohono O'odham | 0.0 /100 | #343 | Tragic 8.7% |
| Tsimshian | 0.0 /100 | #344 | Tragic 8.8% |
| Puerto Ricans | 0.0 /100 | #345 | Tragic 8.9% |
| Houma | 0.0 /100 | #346 | Tragic 9.3% |
| Lumbee | 0.0 /100 | #347 | Tragic 9.5% |