Immigrants from Burma/Myanmar vs Bhutanese Ambulatory Disability
COMPARE
Immigrants from Burma/Myanmar
Bhutanese
Ambulatory Disability
Ambulatory Disability Comparison
Immigrants from Burma/Myanmar
Bhutanese
6.1%
AMBULATORY DISABILITY
52.2/ 100
METRIC RATING
172nd/ 347
METRIC RANK
5.8%
AMBULATORY DISABILITY
98.8/ 100
METRIC RATING
89th/ 347
METRIC RANK
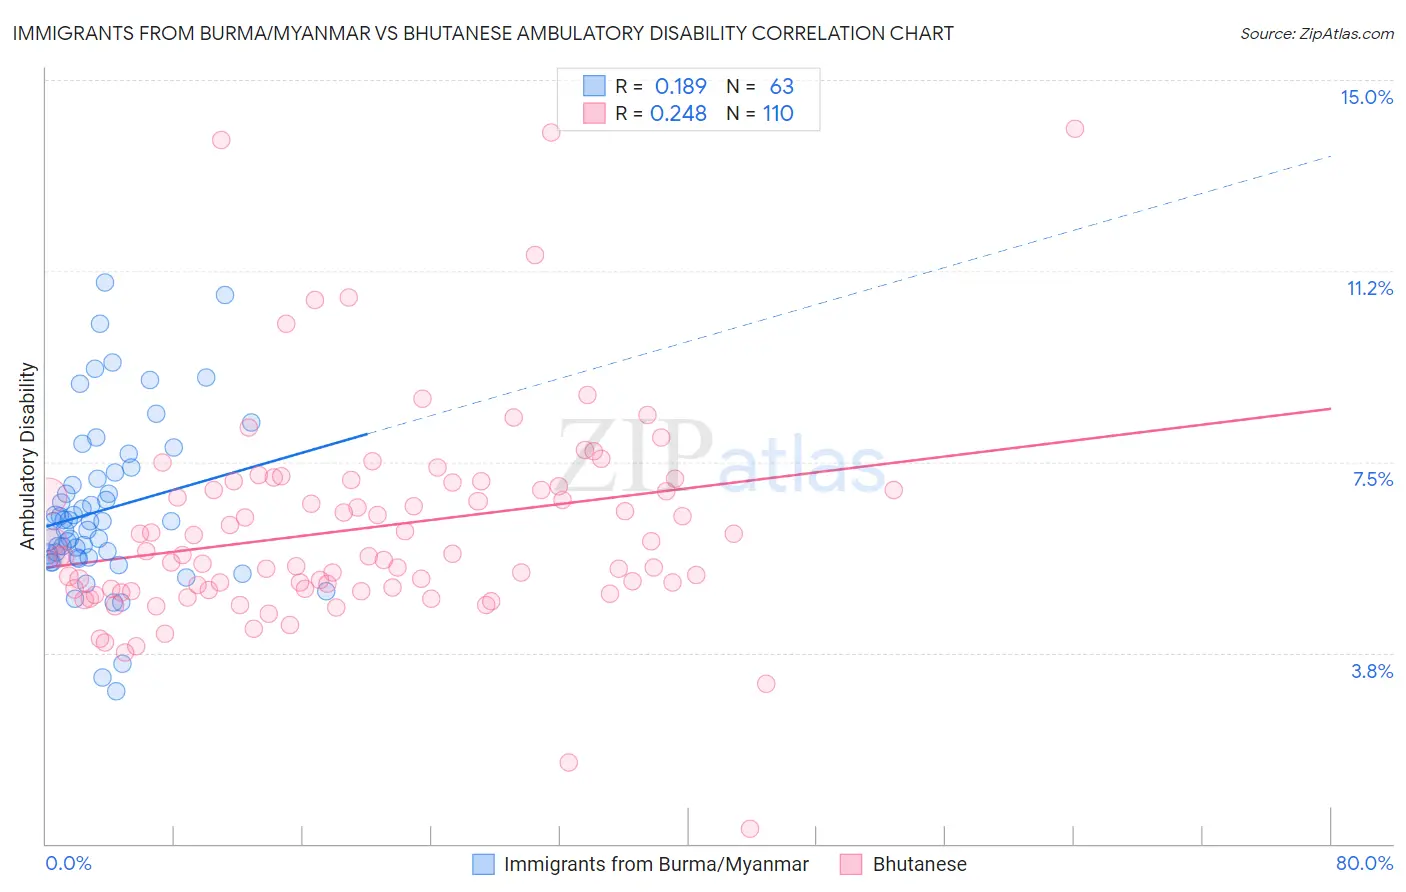
Immigrants from Burma/Myanmar vs Bhutanese Ambulatory Disability Correlation Chart
The statistical analysis conducted on geographies consisting of 172,292,594 people shows a poor positive correlation between the proportion of Immigrants from Burma/Myanmar and percentage of population with ambulatory disability in the United States with a correlation coefficient (R) of 0.189 and weighted average of 6.1%. Similarly, the statistical analysis conducted on geographies consisting of 455,305,094 people shows a weak positive correlation between the proportion of Bhutanese and percentage of population with ambulatory disability in the United States with a correlation coefficient (R) of 0.248 and weighted average of 5.8%, a difference of 6.1%.
Ambulatory Disability Correlation Summary
| Measurement | Immigrants from Burma/Myanmar | Bhutanese |
| Minimum | 3.0% | 0.28% |
| Maximum | 11.0% | 14.0% |
| Range | 8.0% | 13.8% |
| Mean | 6.6% | 6.2% |
| Median | 6.3% | 5.7% |
| Interquartile 25% (IQ1) | 5.6% | 5.0% |
| Interquartile 75% (IQ3) | 7.3% | 7.0% |
| Interquartile Range (IQR) | 1.7% | 2.0% |
| Standard Deviation (Sample) | 1.6% | 2.1% |
| Standard Deviation (Population) | 1.6% | 2.1% |
Similar Demographics by Ambulatory Disability
Demographics Similar to Immigrants from Burma/Myanmar by Ambulatory Disability
In terms of ambulatory disability, the demographic groups most similar to Immigrants from Burma/Myanmar are Moroccan (6.1%, a difference of 0.020%), Croatian (6.1%, a difference of 0.050%), Immigrants from Ecuador (6.1%, a difference of 0.090%), Immigrants from Canada (6.1%, a difference of 0.11%), and Vietnamese (6.1%, a difference of 0.26%).
| Demographics | Rating | Rank | Ambulatory Disability |
| Nicaraguans | 63.2 /100 | #165 | Good 6.1% |
| Iraqis | 62.8 /100 | #166 | Good 6.1% |
| Immigrants | Oceania | 60.7 /100 | #167 | Good 6.1% |
| Ecuadorians | 60.5 /100 | #168 | Good 6.1% |
| Immigrants | Southern Europe | 58.1 /100 | #169 | Average 6.1% |
| Immigrants | Ecuador | 53.8 /100 | #170 | Average 6.1% |
| Moroccans | 52.6 /100 | #171 | Average 6.1% |
| Immigrants | Burma/Myanmar | 52.2 /100 | #172 | Average 6.1% |
| Croatians | 51.2 /100 | #173 | Average 6.1% |
| Immigrants | Canada | 50.0 /100 | #174 | Average 6.1% |
| Vietnamese | 47.2 /100 | #175 | Average 6.1% |
| Immigrants | North America | 45.6 /100 | #176 | Average 6.1% |
| Immigrants | England | 45.4 /100 | #177 | Average 6.1% |
| Scandinavians | 44.5 /100 | #178 | Average 6.1% |
| Austrians | 44.1 /100 | #179 | Average 6.1% |
Demographics Similar to Bhutanese by Ambulatory Disability
In terms of ambulatory disability, the demographic groups most similar to Bhutanese are Australian (5.8%, a difference of 0.0%), Immigrants from Sudan (5.8%, a difference of 0.0%), Soviet Union (5.8%, a difference of 0.12%), Immigrants from Chile (5.8%, a difference of 0.16%), and Immigrants from Sierra Leone (5.8%, a difference of 0.17%).
| Demographics | Rating | Rank | Ambulatory Disability |
| Palestinians | 99.2 /100 | #82 | Exceptional 5.7% |
| Eastern Europeans | 99.2 /100 | #83 | Exceptional 5.7% |
| Ugandans | 99.2 /100 | #84 | Exceptional 5.7% |
| South Americans | 99.0 /100 | #85 | Exceptional 5.7% |
| Latvians | 99.0 /100 | #86 | Exceptional 5.7% |
| Immigrants | Chile | 98.9 /100 | #87 | Exceptional 5.8% |
| Soviet Union | 98.9 /100 | #88 | Exceptional 5.8% |
| Bhutanese | 98.8 /100 | #89 | Exceptional 5.8% |
| Australians | 98.8 /100 | #90 | Exceptional 5.8% |
| Immigrants | Sudan | 98.8 /100 | #91 | Exceptional 5.8% |
| Immigrants | Sierra Leone | 98.6 /100 | #92 | Exceptional 5.8% |
| Immigrants | Denmark | 98.6 /100 | #93 | Exceptional 5.8% |
| Kenyans | 98.4 /100 | #94 | Exceptional 5.8% |
| Immigrants | El Salvador | 98.4 /100 | #95 | Exceptional 5.8% |
| Salvadorans | 98.4 /100 | #96 | Exceptional 5.8% |