Immigrants from Burma/Myanmar vs European Ambulatory Disability
COMPARE
Immigrants from Burma/Myanmar
European
Ambulatory Disability
Ambulatory Disability Comparison
Immigrants from Burma/Myanmar
Europeans
6.1%
AMBULATORY DISABILITY
52.2/ 100
METRIC RATING
172nd/ 347
METRIC RANK
6.2%
AMBULATORY DISABILITY
36.2/ 100
METRIC RATING
186th/ 347
METRIC RANK
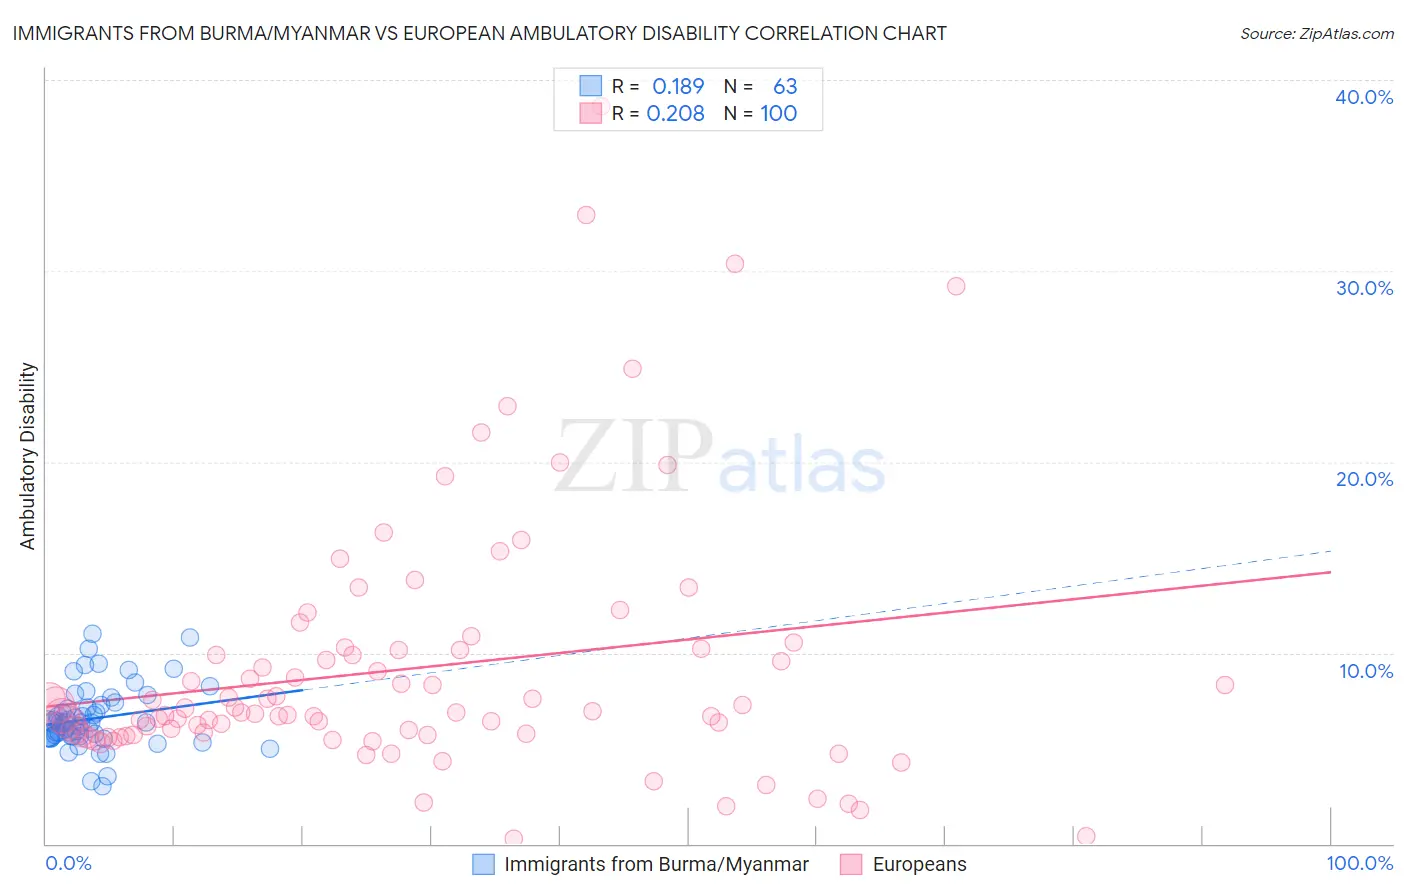
Immigrants from Burma/Myanmar vs European Ambulatory Disability Correlation Chart
The statistical analysis conducted on geographies consisting of 172,292,594 people shows a poor positive correlation between the proportion of Immigrants from Burma/Myanmar and percentage of population with ambulatory disability in the United States with a correlation coefficient (R) of 0.189 and weighted average of 6.1%. Similarly, the statistical analysis conducted on geographies consisting of 561,341,631 people shows a weak positive correlation between the proportion of Europeans and percentage of population with ambulatory disability in the United States with a correlation coefficient (R) of 0.208 and weighted average of 6.2%, a difference of 0.86%.
Ambulatory Disability Correlation Summary
| Measurement | Immigrants from Burma/Myanmar | European |
| Minimum | 3.0% | 0.26% |
| Maximum | 11.0% | 38.6% |
| Range | 8.0% | 38.4% |
| Mean | 6.6% | 9.2% |
| Median | 6.3% | 6.9% |
| Interquartile 25% (IQ1) | 5.6% | 5.7% |
| Interquartile 75% (IQ3) | 7.3% | 10.2% |
| Interquartile Range (IQR) | 1.7% | 4.5% |
| Standard Deviation (Sample) | 1.6% | 6.7% |
| Standard Deviation (Population) | 1.6% | 6.7% |
Demographics Similar to Immigrants from Burma/Myanmar and Europeans by Ambulatory Disability
In terms of ambulatory disability, the demographic groups most similar to Immigrants from Burma/Myanmar are Moroccan (6.1%, a difference of 0.020%), Croatian (6.1%, a difference of 0.050%), Immigrants from Ecuador (6.1%, a difference of 0.090%), Immigrants from Canada (6.1%, a difference of 0.11%), and Vietnamese (6.1%, a difference of 0.26%). Similarly, the demographic groups most similar to Europeans are Carpatho Rusyn (6.2%, a difference of 0.050%), Immigrants from Bosnia and Herzegovina (6.2%, a difference of 0.060%), British (6.2%, a difference of 0.11%), Ukrainian (6.2%, a difference of 0.13%), and Immigrants from Ghana (6.1%, a difference of 0.28%).
| Demographics | Rating | Rank | Ambulatory Disability |
| Immigrants | Southern Europe | 58.1 /100 | #169 | Average 6.1% |
| Immigrants | Ecuador | 53.8 /100 | #170 | Average 6.1% |
| Moroccans | 52.6 /100 | #171 | Average 6.1% |
| Immigrants | Burma/Myanmar | 52.2 /100 | #172 | Average 6.1% |
| Croatians | 51.2 /100 | #173 | Average 6.1% |
| Immigrants | Canada | 50.0 /100 | #174 | Average 6.1% |
| Vietnamese | 47.2 /100 | #175 | Average 6.1% |
| Immigrants | North America | 45.6 /100 | #176 | Average 6.1% |
| Immigrants | England | 45.4 /100 | #177 | Average 6.1% |
| Scandinavians | 44.5 /100 | #178 | Average 6.1% |
| Austrians | 44.1 /100 | #179 | Average 6.1% |
| Immigrants | Nicaragua | 43.9 /100 | #180 | Average 6.1% |
| Swiss | 43.1 /100 | #181 | Average 6.1% |
| Serbians | 42.8 /100 | #182 | Average 6.1% |
| Immigrants | Thailand | 42.2 /100 | #183 | Average 6.1% |
| Immigrants | Ghana | 41.2 /100 | #184 | Average 6.1% |
| Immigrants | Bosnia and Herzegovina | 37.2 /100 | #185 | Fair 6.2% |
| Europeans | 36.2 /100 | #186 | Fair 6.2% |
| Carpatho Rusyns | 35.3 /100 | #187 | Fair 6.2% |
| British | 34.3 /100 | #188 | Fair 6.2% |
| Ukrainians | 34.0 /100 | #189 | Fair 6.2% |