Immigrants from Burma/Myanmar vs Tsimshian Professional Degree
COMPARE
Immigrants from Burma/Myanmar
Tsimshian
Professional Degree
Professional Degree Comparison
Immigrants from Burma/Myanmar
Tsimshian
3.9%
PROFESSIONAL DEGREE
5.4/ 100
METRIC RATING
229th/ 347
METRIC RANK
3.2%
PROFESSIONAL DEGREE
0.0/ 100
METRIC RATING
321st/ 347
METRIC RANK
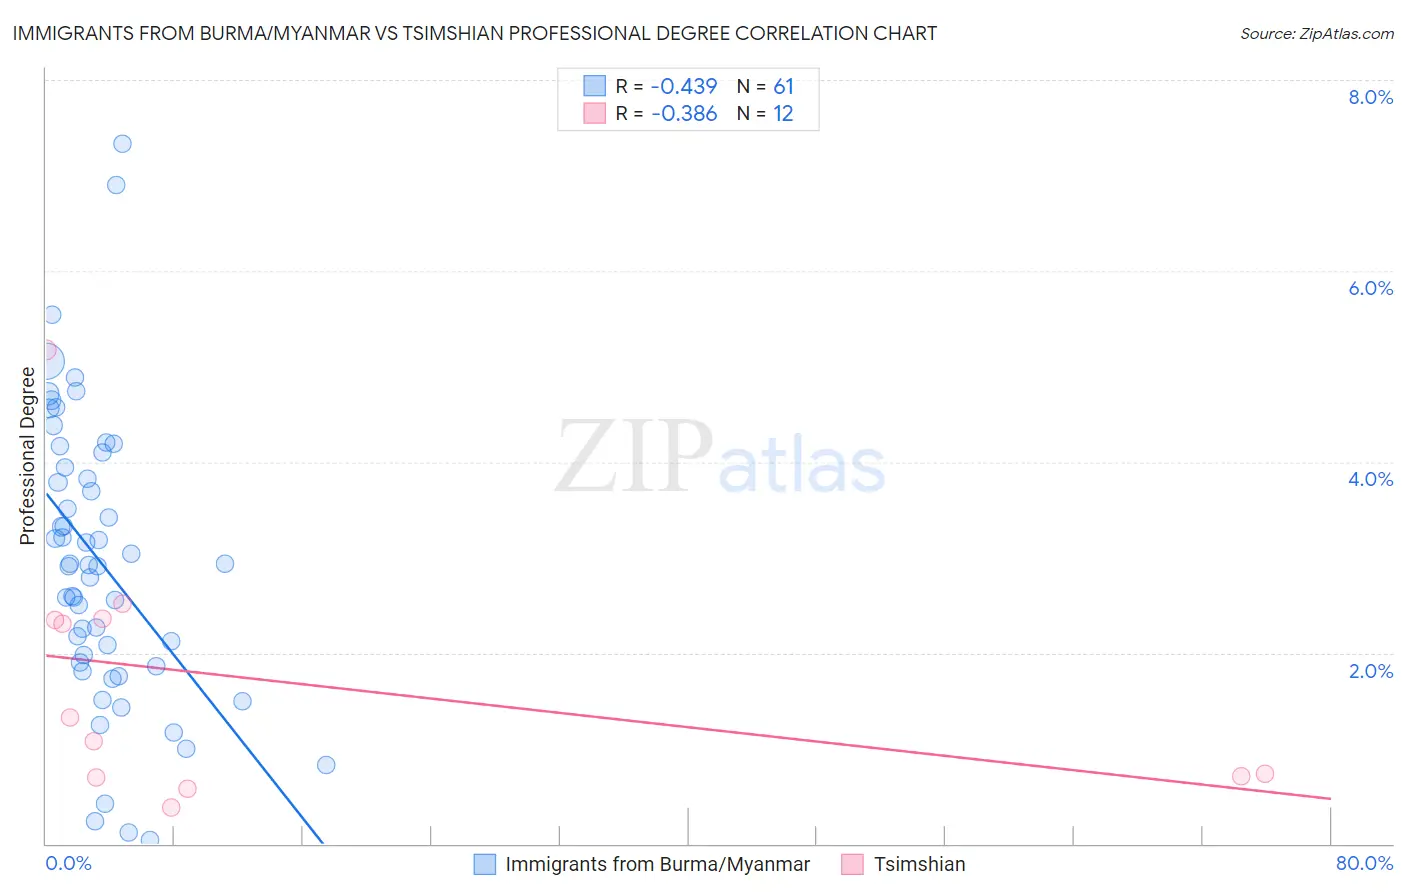
Immigrants from Burma/Myanmar vs Tsimshian Professional Degree Correlation Chart
The statistical analysis conducted on geographies consisting of 172,191,729 people shows a moderate negative correlation between the proportion of Immigrants from Burma/Myanmar and percentage of population with at least professional degree education in the United States with a correlation coefficient (R) of -0.439 and weighted average of 3.9%. Similarly, the statistical analysis conducted on geographies consisting of 15,614,727 people shows a mild negative correlation between the proportion of Tsimshian and percentage of population with at least professional degree education in the United States with a correlation coefficient (R) of -0.386 and weighted average of 3.2%, a difference of 24.1%.
Professional Degree Correlation Summary
| Measurement | Immigrants from Burma/Myanmar | Tsimshian |
| Minimum | 0.034% | 0.38% |
| Maximum | 7.3% | 5.2% |
| Range | 7.3% | 4.8% |
| Mean | 3.0% | 1.7% |
| Median | 2.9% | 1.2% |
| Interquartile 25% (IQ1) | 1.9% | 0.71% |
| Interquartile 75% (IQ3) | 4.0% | 2.4% |
| Interquartile Range (IQR) | 2.1% | 1.6% |
| Standard Deviation (Sample) | 1.5% | 1.4% |
| Standard Deviation (Population) | 1.5% | 1.3% |
Similar Demographics by Professional Degree
Demographics Similar to Immigrants from Burma/Myanmar by Professional Degree
In terms of professional degree, the demographic groups most similar to Immigrants from Burma/Myanmar are Immigrants from West Indies (4.0%, a difference of 0.14%), Nicaraguan (3.9%, a difference of 0.27%), Cuban (4.0%, a difference of 0.39%), German Russian (4.0%, a difference of 0.52%), and Ecuadorian (3.9%, a difference of 0.73%).
| Demographics | Rating | Rank | Professional Degree |
| Immigrants | Western Africa | 7.5 /100 | #222 | Tragic 4.0% |
| Immigrants | Bosnia and Herzegovina | 7.4 /100 | #223 | Tragic 4.0% |
| Trinidadians and Tobagonians | 7.1 /100 | #224 | Tragic 4.0% |
| Tlingit-Haida | 6.9 /100 | #225 | Tragic 4.0% |
| German Russians | 6.1 /100 | #226 | Tragic 4.0% |
| Cubans | 5.9 /100 | #227 | Tragic 4.0% |
| Immigrants | West Indies | 5.6 /100 | #228 | Tragic 4.0% |
| Immigrants | Burma/Myanmar | 5.4 /100 | #229 | Tragic 3.9% |
| Nicaraguans | 5.1 /100 | #230 | Tragic 3.9% |
| Ecuadorians | 4.6 /100 | #231 | Tragic 3.9% |
| Cree | 4.3 /100 | #232 | Tragic 3.9% |
| Immigrants | Philippines | 4.1 /100 | #233 | Tragic 3.9% |
| Immigrants | Nonimmigrants | 4.0 /100 | #234 | Tragic 3.9% |
| Immigrants | Barbados | 4.0 /100 | #235 | Tragic 3.9% |
| Spanish Americans | 3.8 /100 | #236 | Tragic 3.9% |
Demographics Similar to Tsimshian by Professional Degree
In terms of professional degree, the demographic groups most similar to Tsimshian are Seminole (3.2%, a difference of 0.36%), Hispanic or Latino (3.2%, a difference of 0.36%), Inupiat (3.2%, a difference of 0.44%), Crow (3.2%, a difference of 0.72%), and Yaqui (3.2%, a difference of 0.78%).
| Demographics | Rating | Rank | Professional Degree |
| Mexican American Indians | 0.1 /100 | #314 | Tragic 3.3% |
| Immigrants | Laos | 0.1 /100 | #315 | Tragic 3.2% |
| Puerto Ricans | 0.1 /100 | #316 | Tragic 3.2% |
| Nepalese | 0.1 /100 | #317 | Tragic 3.2% |
| Immigrants | Micronesia | 0.1 /100 | #318 | Tragic 3.2% |
| Choctaw | 0.1 /100 | #319 | Tragic 3.2% |
| Seminole | 0.1 /100 | #320 | Tragic 3.2% |
| Tsimshian | 0.0 /100 | #321 | Tragic 3.2% |
| Hispanics or Latinos | 0.0 /100 | #322 | Tragic 3.2% |
| Inupiat | 0.0 /100 | #323 | Tragic 3.2% |
| Crow | 0.0 /100 | #324 | Tragic 3.2% |
| Yaqui | 0.0 /100 | #325 | Tragic 3.2% |
| Menominee | 0.0 /100 | #326 | Tragic 3.1% |
| Dutch West Indians | 0.0 /100 | #327 | Tragic 3.1% |
| Creek | 0.0 /100 | #328 | Tragic 3.1% |