Immigrants from Colombia vs Tsimshian Ambulatory Disability
COMPARE
Immigrants from Colombia
Tsimshian
Ambulatory Disability
Ambulatory Disability Comparison
Immigrants from Colombia
Tsimshian
5.8%
AMBULATORY DISABILITY
96.7/ 100
METRIC RATING
110th/ 347
METRIC RANK
8.8%
AMBULATORY DISABILITY
0.0/ 100
METRIC RATING
344th/ 347
METRIC RANK
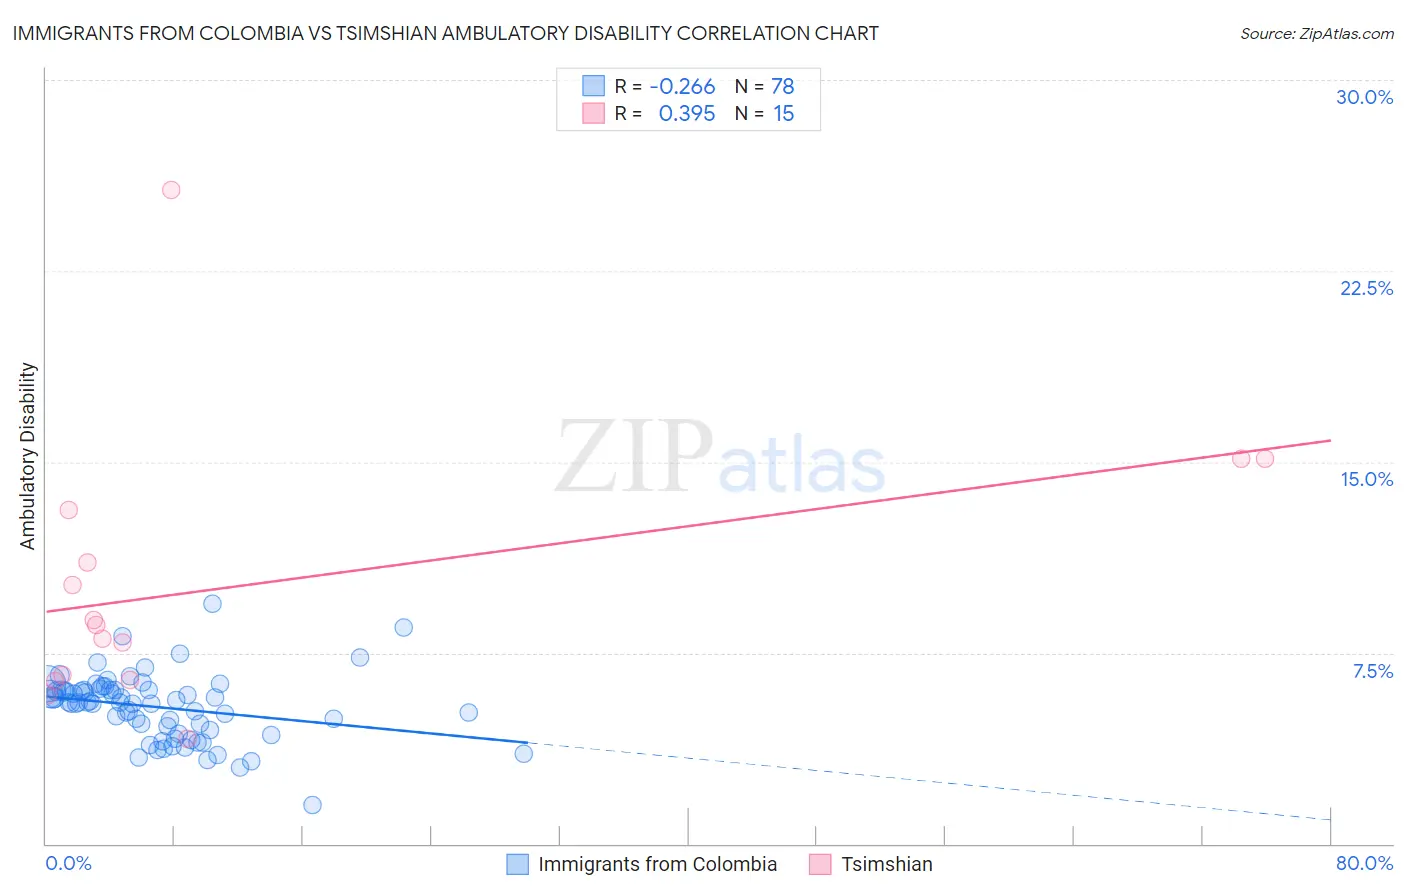
Immigrants from Colombia vs Tsimshian Ambulatory Disability Correlation Chart
The statistical analysis conducted on geographies consisting of 378,592,310 people shows a weak negative correlation between the proportion of Immigrants from Colombia and percentage of population with ambulatory disability in the United States with a correlation coefficient (R) of -0.266 and weighted average of 5.8%. Similarly, the statistical analysis conducted on geographies consisting of 15,626,544 people shows a mild positive correlation between the proportion of Tsimshian and percentage of population with ambulatory disability in the United States with a correlation coefficient (R) of 0.395 and weighted average of 8.8%, a difference of 51.0%.
Ambulatory Disability Correlation Summary
| Measurement | Immigrants from Colombia | Tsimshian |
| Minimum | 1.5% | 4.1% |
| Maximum | 9.4% | 25.7% |
| Range | 7.9% | 21.5% |
| Mean | 5.4% | 10.2% |
| Median | 5.6% | 8.6% |
| Interquartile 25% (IQ1) | 4.5% | 6.5% |
| Interquartile 75% (IQ3) | 6.0% | 13.1% |
| Interquartile Range (IQR) | 1.6% | 6.6% |
| Standard Deviation (Sample) | 1.3% | 5.4% |
| Standard Deviation (Population) | 1.3% | 5.2% |
Similar Demographics by Ambulatory Disability
Demographics Similar to Immigrants from Colombia by Ambulatory Disability
In terms of ambulatory disability, the demographic groups most similar to Immigrants from Colombia are Danish (5.8%, a difference of 0.070%), Immigrants from Netherlands (5.8%, a difference of 0.18%), Colombian (5.8%, a difference of 0.19%), South African (5.9%, a difference of 0.20%), and Uruguayan (5.8%, a difference of 0.21%).
| Demographics | Rating | Rank | Ambulatory Disability |
| Immigrants | Romania | 97.7 /100 | #103 | Exceptional 5.8% |
| New Zealanders | 97.6 /100 | #104 | Exceptional 5.8% |
| Immigrants | Czechoslovakia | 97.4 /100 | #105 | Exceptional 5.8% |
| Immigrants | Morocco | 97.3 /100 | #106 | Exceptional 5.8% |
| Uruguayans | 97.2 /100 | #107 | Exceptional 5.8% |
| Colombians | 97.2 /100 | #108 | Exceptional 5.8% |
| Immigrants | Netherlands | 97.1 /100 | #109 | Exceptional 5.8% |
| Immigrants | Colombia | 96.7 /100 | #110 | Exceptional 5.8% |
| Danes | 96.6 /100 | #111 | Exceptional 5.8% |
| South Africans | 96.3 /100 | #112 | Exceptional 5.9% |
| Immigrants | Uruguay | 95.6 /100 | #113 | Exceptional 5.9% |
| Immigrants | Poland | 95.4 /100 | #114 | Exceptional 5.9% |
| South American Indians | 94.8 /100 | #115 | Exceptional 5.9% |
| Immigrants | Africa | 94.7 /100 | #116 | Exceptional 5.9% |
| Immigrants | South Eastern Asia | 93.6 /100 | #117 | Exceptional 5.9% |
Demographics Similar to Tsimshian by Ambulatory Disability
In terms of ambulatory disability, the demographic groups most similar to Tsimshian are Puerto Rican (8.9%, a difference of 0.59%), Tohono O'odham (8.7%, a difference of 0.97%), Kiowa (8.6%, a difference of 2.5%), Creek (8.5%, a difference of 4.4%), and Houma (9.3%, a difference of 5.5%).
| Demographics | Rating | Rank | Ambulatory Disability |
| Cherokee | 0.0 /100 | #333 | Tragic 7.9% |
| Yuman | 0.0 /100 | #334 | Tragic 7.9% |
| Chickasaw | 0.0 /100 | #335 | Tragic 8.0% |
| Seminole | 0.0 /100 | #336 | Tragic 8.0% |
| Dutch West Indians | 0.0 /100 | #337 | Tragic 8.2% |
| Colville | 0.0 /100 | #338 | Tragic 8.2% |
| Pima | 0.0 /100 | #339 | Tragic 8.2% |
| Choctaw | 0.0 /100 | #340 | Tragic 8.3% |
| Creek | 0.0 /100 | #341 | Tragic 8.5% |
| Kiowa | 0.0 /100 | #342 | Tragic 8.6% |
| Tohono O'odham | 0.0 /100 | #343 | Tragic 8.7% |
| Tsimshian | 0.0 /100 | #344 | Tragic 8.8% |
| Puerto Ricans | 0.0 /100 | #345 | Tragic 8.9% |
| Houma | 0.0 /100 | #346 | Tragic 9.3% |
| Lumbee | 0.0 /100 | #347 | Tragic 9.5% |