Immigrants from Burma/Myanmar vs Menominee Disability Age 65 to 74
COMPARE
Immigrants from Burma/Myanmar
Menominee
Disability Age 65 to 74
Disability Age 65 to 74 Comparison
Immigrants from Burma/Myanmar
Menominee
24.0%
DISABILITY AGE 65 TO 74
11.6/ 100
METRIC RATING
219th/ 347
METRIC RANK
27.4%
DISABILITY AGE 65 TO 74
0.0/ 100
METRIC RATING
311th/ 347
METRIC RANK
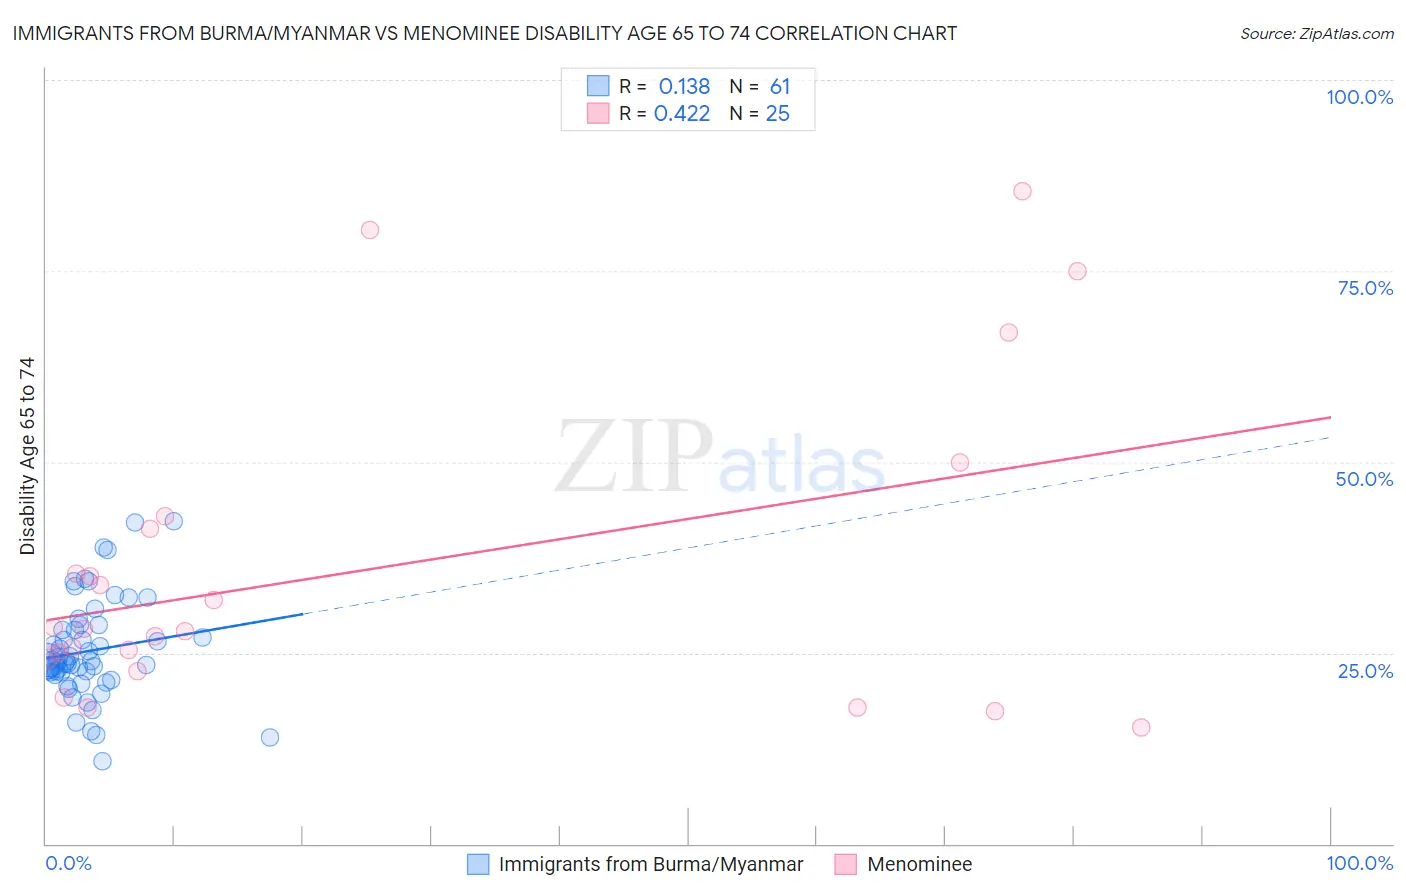
Immigrants from Burma/Myanmar vs Menominee Disability Age 65 to 74 Correlation Chart
The statistical analysis conducted on geographies consisting of 172,172,101 people shows a poor positive correlation between the proportion of Immigrants from Burma/Myanmar and percentage of population with a disability between the ages 65 and 75 in the United States with a correlation coefficient (R) of 0.138 and weighted average of 24.0%. Similarly, the statistical analysis conducted on geographies consisting of 45,777,170 people shows a moderate positive correlation between the proportion of Menominee and percentage of population with a disability between the ages 65 and 75 in the United States with a correlation coefficient (R) of 0.422 and weighted average of 27.4%, a difference of 14.2%.
Disability Age 65 to 74 Correlation Summary
| Measurement | Immigrants from Burma/Myanmar | Menominee |
| Minimum | 10.8% | 15.2% |
| Maximum | 42.1% | 85.4% |
| Range | 31.3% | 70.3% |
| Mean | 25.3% | 36.0% |
| Median | 23.9% | 28.1% |
| Interquartile 25% (IQ1) | 22.3% | 23.6% |
| Interquartile 75% (IQ3) | 28.3% | 42.1% |
| Interquartile Range (IQR) | 6.0% | 18.5% |
| Standard Deviation (Sample) | 6.5% | 20.2% |
| Standard Deviation (Population) | 6.4% | 19.8% |
Similar Demographics by Disability Age 65 to 74
Demographics Similar to Immigrants from Burma/Myanmar by Disability Age 65 to 74
In terms of disability age 65 to 74, the demographic groups most similar to Immigrants from Burma/Myanmar are Immigrants from Portugal (24.0%, a difference of 0.020%), Immigrants from Nigeria (24.0%, a difference of 0.020%), Jamaican (24.0%, a difference of 0.090%), Ghanaian (24.1%, a difference of 0.18%), and Pennsylvania German (24.0%, a difference of 0.22%).
| Demographics | Rating | Rank | Disability Age 65 to 74 |
| French | 15.7 /100 | #212 | Poor 23.9% |
| Nicaraguans | 14.3 /100 | #213 | Poor 23.9% |
| Immigrants | Oceania | 13.6 /100 | #214 | Poor 24.0% |
| Pennsylvania Germans | 13.3 /100 | #215 | Poor 24.0% |
| Jamaicans | 12.2 /100 | #216 | Poor 24.0% |
| Immigrants | Portugal | 11.7 /100 | #217 | Poor 24.0% |
| Immigrants | Nigeria | 11.7 /100 | #218 | Poor 24.0% |
| Immigrants | Burma/Myanmar | 11.6 /100 | #219 | Poor 24.0% |
| Ghanaians | 10.4 /100 | #220 | Poor 24.1% |
| Immigrants | Nicaragua | 9.8 /100 | #221 | Tragic 24.1% |
| Native Hawaiians | 9.3 /100 | #222 | Tragic 24.1% |
| Immigrants | Middle Africa | 8.9 /100 | #223 | Tragic 24.1% |
| Immigrants | Panama | 8.6 /100 | #224 | Tragic 24.1% |
| Bermudans | 8.2 /100 | #225 | Tragic 24.2% |
| Iraqis | 8.1 /100 | #226 | Tragic 24.2% |
Demographics Similar to Menominee by Disability Age 65 to 74
In terms of disability age 65 to 74, the demographic groups most similar to Menominee are Osage (27.5%, a difference of 0.080%), Shoshone (27.4%, a difference of 0.23%), Yaqui (27.4%, a difference of 0.27%), Sioux (27.3%, a difference of 0.34%), and Ute (27.3%, a difference of 0.49%).
| Demographics | Rating | Rank | Disability Age 65 to 74 |
| Puget Sound Salish | 0.0 /100 | #304 | Tragic 27.2% |
| Mexicans | 0.0 /100 | #305 | Tragic 27.2% |
| Blacks/African Americans | 0.0 /100 | #306 | Tragic 27.3% |
| Ute | 0.0 /100 | #307 | Tragic 27.3% |
| Sioux | 0.0 /100 | #308 | Tragic 27.3% |
| Yaqui | 0.0 /100 | #309 | Tragic 27.4% |
| Shoshone | 0.0 /100 | #310 | Tragic 27.4% |
| Menominee | 0.0 /100 | #311 | Tragic 27.4% |
| Osage | 0.0 /100 | #312 | Tragic 27.5% |
| Paiute | 0.0 /100 | #313 | Tragic 27.8% |
| Chippewa | 0.0 /100 | #314 | Tragic 27.8% |
| Cajuns | 0.0 /100 | #315 | Tragic 27.9% |
| Crow | 0.0 /100 | #316 | Tragic 27.9% |
| Immigrants | Armenia | 0.0 /100 | #317 | Tragic 28.0% |
| Nepalese | 0.0 /100 | #318 | Tragic 28.0% |