Cherokee vs Menominee Disability Age 65 to 74
COMPARE
Cherokee
Menominee
Disability Age 65 to 74
Disability Age 65 to 74 Comparison
Cherokee
Menominee
28.2%
DISABILITY AGE 65 TO 74
0.0/ 100
METRIC RATING
320th/ 347
METRIC RANK
27.4%
DISABILITY AGE 65 TO 74
0.0/ 100
METRIC RATING
311th/ 347
METRIC RANK
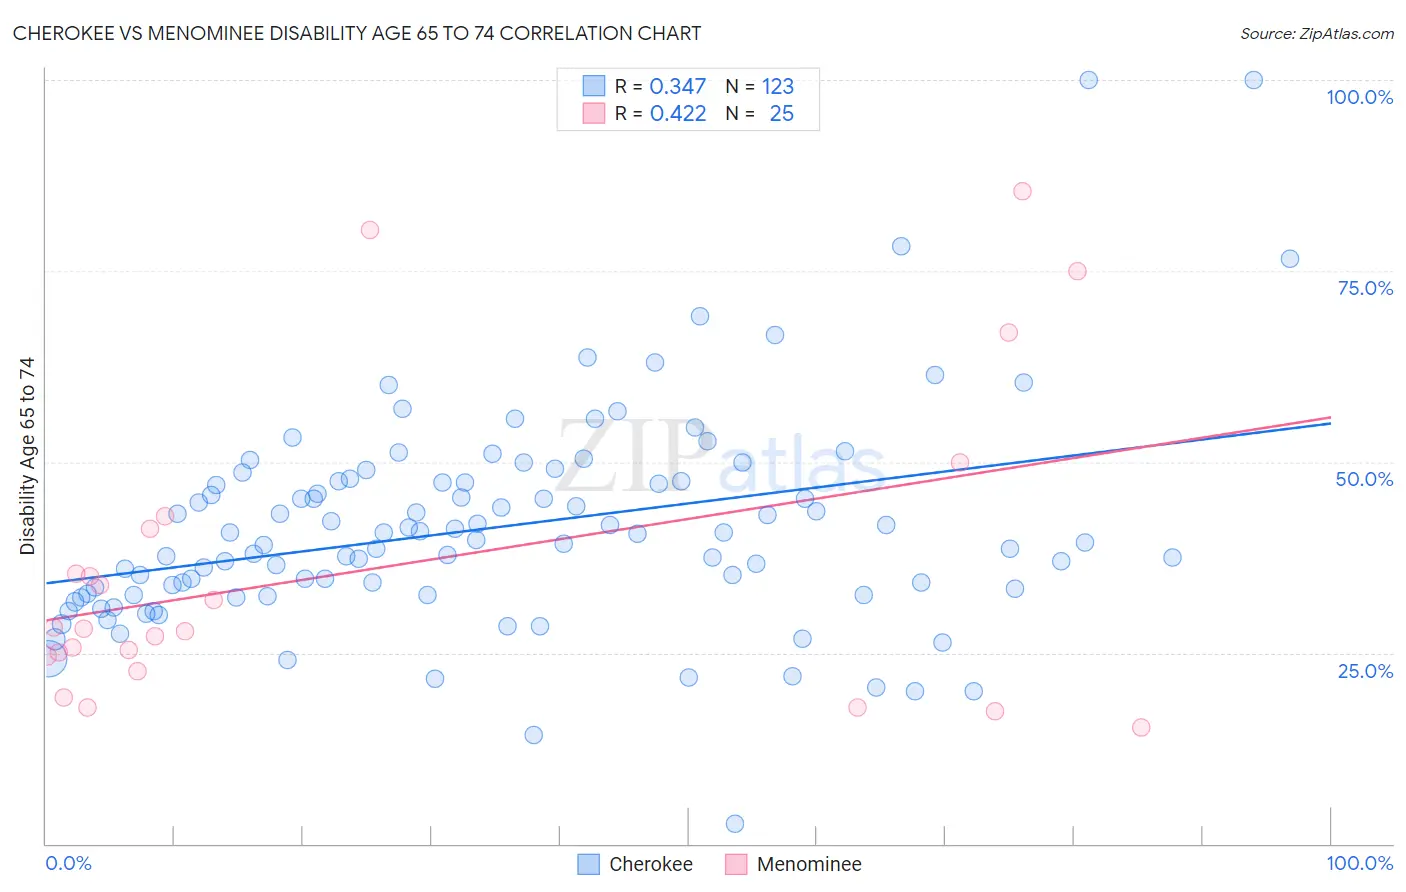
Cherokee vs Menominee Disability Age 65 to 74 Correlation Chart
The statistical analysis conducted on geographies consisting of 492,470,212 people shows a mild positive correlation between the proportion of Cherokee and percentage of population with a disability between the ages 65 and 75 in the United States with a correlation coefficient (R) of 0.347 and weighted average of 28.2%. Similarly, the statistical analysis conducted on geographies consisting of 45,777,170 people shows a moderate positive correlation between the proportion of Menominee and percentage of population with a disability between the ages 65 and 75 in the United States with a correlation coefficient (R) of 0.422 and weighted average of 27.4%, a difference of 2.8%.
Disability Age 65 to 74 Correlation Summary
| Measurement | Cherokee | Menominee |
| Minimum | 2.6% | 15.2% |
| Maximum | 100.0% | 85.4% |
| Range | 97.4% | 70.3% |
| Mean | 41.4% | 36.0% |
| Median | 39.7% | 28.1% |
| Interquartile 25% (IQ1) | 32.6% | 23.6% |
| Interquartile 75% (IQ3) | 47.4% | 42.1% |
| Interquartile Range (IQR) | 14.8% | 18.5% |
| Standard Deviation (Sample) | 14.2% | 20.2% |
| Standard Deviation (Population) | 14.1% | 19.8% |
Demographics Similar to Cherokee and Menominee by Disability Age 65 to 74
In terms of disability age 65 to 74, the demographic groups most similar to Cherokee are Arapaho (28.1%, a difference of 0.39%), Comanche (28.3%, a difference of 0.51%), Nepalese (28.0%, a difference of 0.62%), Immigrants from Armenia (28.0%, a difference of 0.84%), and Aleut (28.4%, a difference of 0.84%). Similarly, the demographic groups most similar to Menominee are Osage (27.5%, a difference of 0.080%), Shoshone (27.4%, a difference of 0.23%), Yaqui (27.4%, a difference of 0.27%), Sioux (27.3%, a difference of 0.34%), and Ute (27.3%, a difference of 0.49%).
| Demographics | Rating | Rank | Disability Age 65 to 74 |
| Mexicans | 0.0 /100 | #305 | Tragic 27.2% |
| Blacks/African Americans | 0.0 /100 | #306 | Tragic 27.3% |
| Ute | 0.0 /100 | #307 | Tragic 27.3% |
| Sioux | 0.0 /100 | #308 | Tragic 27.3% |
| Yaqui | 0.0 /100 | #309 | Tragic 27.4% |
| Shoshone | 0.0 /100 | #310 | Tragic 27.4% |
| Menominee | 0.0 /100 | #311 | Tragic 27.4% |
| Osage | 0.0 /100 | #312 | Tragic 27.5% |
| Paiute | 0.0 /100 | #313 | Tragic 27.8% |
| Chippewa | 0.0 /100 | #314 | Tragic 27.8% |
| Cajuns | 0.0 /100 | #315 | Tragic 27.9% |
| Crow | 0.0 /100 | #316 | Tragic 27.9% |
| Immigrants | Armenia | 0.0 /100 | #317 | Tragic 28.0% |
| Nepalese | 0.0 /100 | #318 | Tragic 28.0% |
| Arapaho | 0.0 /100 | #319 | Tragic 28.1% |
| Cherokee | 0.0 /100 | #320 | Tragic 28.2% |
| Comanche | 0.0 /100 | #321 | Tragic 28.3% |
| Aleuts | 0.0 /100 | #322 | Tragic 28.4% |
| Puerto Ricans | 0.0 /100 | #323 | Tragic 29.1% |
| Seminole | 0.0 /100 | #324 | Tragic 29.4% |
| Dutch West Indians | 0.0 /100 | #325 | Tragic 29.6% |