Immigrants from Afghanistan vs Menominee Disability Age 65 to 74
COMPARE
Immigrants from Afghanistan
Menominee
Disability Age 65 to 74
Disability Age 65 to 74 Comparison
Immigrants from Afghanistan
Menominee
23.2%
DISABILITY AGE 65 TO 74
60.5/ 100
METRIC RATING
166th/ 347
METRIC RANK
27.4%
DISABILITY AGE 65 TO 74
0.0/ 100
METRIC RATING
311th/ 347
METRIC RANK
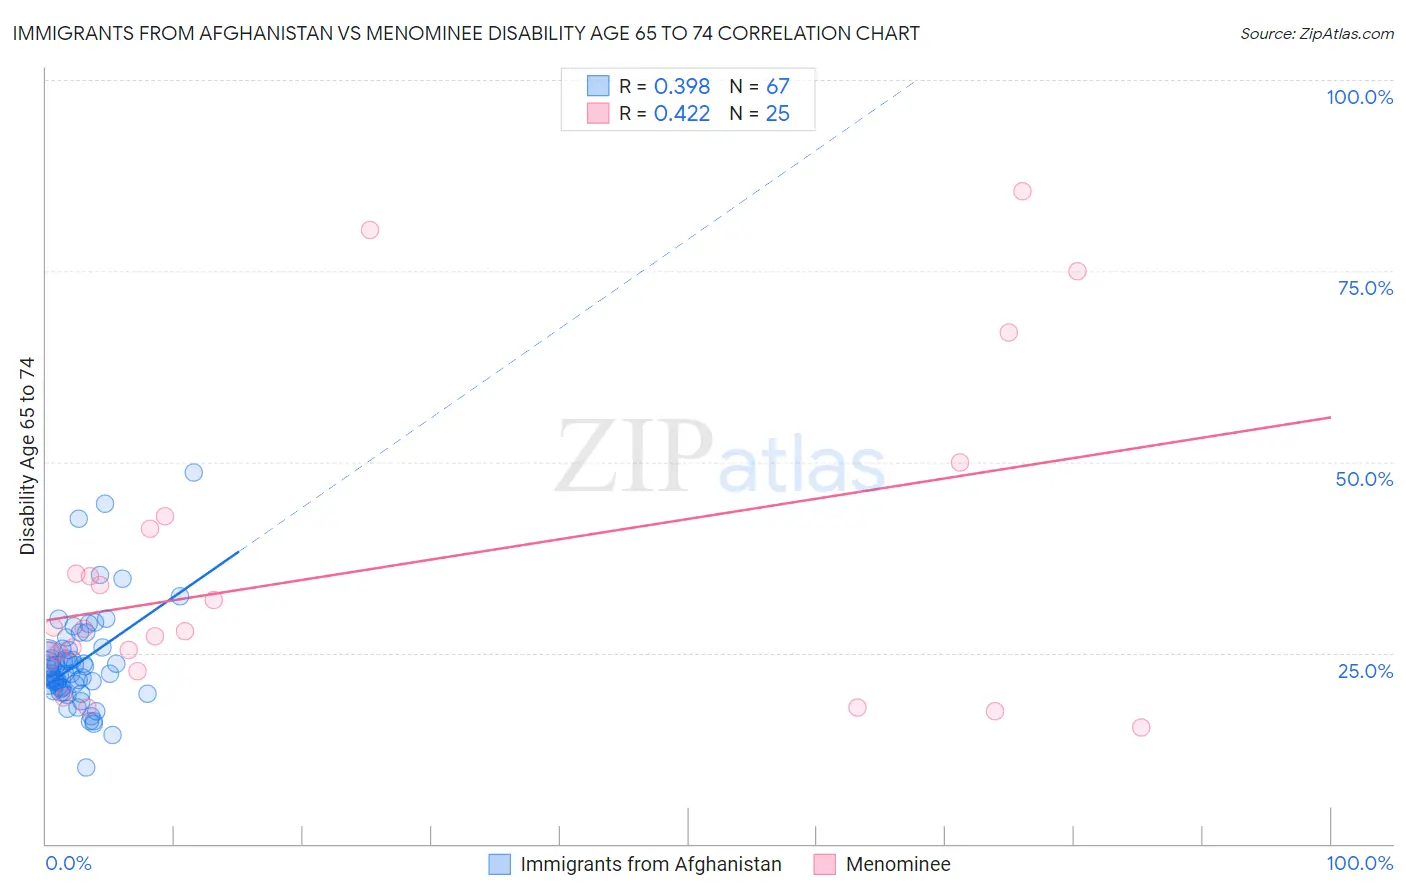
Immigrants from Afghanistan vs Menominee Disability Age 65 to 74 Correlation Chart
The statistical analysis conducted on geographies consisting of 147,591,650 people shows a mild positive correlation between the proportion of Immigrants from Afghanistan and percentage of population with a disability between the ages 65 and 75 in the United States with a correlation coefficient (R) of 0.398 and weighted average of 23.2%. Similarly, the statistical analysis conducted on geographies consisting of 45,777,170 people shows a moderate positive correlation between the proportion of Menominee and percentage of population with a disability between the ages 65 and 75 in the United States with a correlation coefficient (R) of 0.422 and weighted average of 27.4%, a difference of 18.3%.
Disability Age 65 to 74 Correlation Summary
| Measurement | Immigrants from Afghanistan | Menominee |
| Minimum | 10.0% | 15.2% |
| Maximum | 48.7% | 85.4% |
| Range | 38.7% | 70.3% |
| Mean | 23.6% | 36.0% |
| Median | 22.3% | 28.1% |
| Interquartile 25% (IQ1) | 20.4% | 23.6% |
| Interquartile 75% (IQ3) | 25.3% | 42.1% |
| Interquartile Range (IQR) | 4.9% | 18.5% |
| Standard Deviation (Sample) | 6.5% | 20.2% |
| Standard Deviation (Population) | 6.4% | 19.8% |
Similar Demographics by Disability Age 65 to 74
Demographics Similar to Immigrants from Afghanistan by Disability Age 65 to 74
In terms of disability age 65 to 74, the demographic groups most similar to Immigrants from Afghanistan are Sierra Leonean (23.2%, a difference of 0.020%), Vietnamese (23.2%, a difference of 0.020%), European (23.2%, a difference of 0.040%), Immigrants from Philippines (23.2%, a difference of 0.040%), and Immigrants from Bosnia and Herzegovina (23.2%, a difference of 0.18%).
| Demographics | Rating | Rank | Disability Age 65 to 74 |
| South American Indians | 65.5 /100 | #159 | Good 23.1% |
| Koreans | 64.2 /100 | #160 | Good 23.1% |
| Immigrants | Cameroon | 63.8 /100 | #161 | Good 23.1% |
| Europeans | 61.2 /100 | #162 | Good 23.2% |
| Immigrants | Philippines | 61.1 /100 | #163 | Good 23.2% |
| Sierra Leoneans | 60.9 /100 | #164 | Good 23.2% |
| Vietnamese | 60.8 /100 | #165 | Good 23.2% |
| Immigrants | Afghanistan | 60.5 /100 | #166 | Good 23.2% |
| Immigrants | Bosnia and Herzegovina | 57.6 /100 | #167 | Average 23.2% |
| Pakistanis | 57.0 /100 | #168 | Average 23.2% |
| Icelanders | 54.3 /100 | #169 | Average 23.3% |
| Moroccans | 54.2 /100 | #170 | Average 23.3% |
| Cubans | 51.9 /100 | #171 | Average 23.3% |
| Germans | 50.5 /100 | #172 | Average 23.3% |
| Yugoslavians | 50.2 /100 | #173 | Average 23.3% |
Demographics Similar to Menominee by Disability Age 65 to 74
In terms of disability age 65 to 74, the demographic groups most similar to Menominee are Osage (27.5%, a difference of 0.080%), Shoshone (27.4%, a difference of 0.23%), Yaqui (27.4%, a difference of 0.27%), Sioux (27.3%, a difference of 0.34%), and Ute (27.3%, a difference of 0.49%).
| Demographics | Rating | Rank | Disability Age 65 to 74 |
| Puget Sound Salish | 0.0 /100 | #304 | Tragic 27.2% |
| Mexicans | 0.0 /100 | #305 | Tragic 27.2% |
| Blacks/African Americans | 0.0 /100 | #306 | Tragic 27.3% |
| Ute | 0.0 /100 | #307 | Tragic 27.3% |
| Sioux | 0.0 /100 | #308 | Tragic 27.3% |
| Yaqui | 0.0 /100 | #309 | Tragic 27.4% |
| Shoshone | 0.0 /100 | #310 | Tragic 27.4% |
| Menominee | 0.0 /100 | #311 | Tragic 27.4% |
| Osage | 0.0 /100 | #312 | Tragic 27.5% |
| Paiute | 0.0 /100 | #313 | Tragic 27.8% |
| Chippewa | 0.0 /100 | #314 | Tragic 27.8% |
| Cajuns | 0.0 /100 | #315 | Tragic 27.9% |
| Crow | 0.0 /100 | #316 | Tragic 27.9% |
| Immigrants | Armenia | 0.0 /100 | #317 | Tragic 28.0% |
| Nepalese | 0.0 /100 | #318 | Tragic 28.0% |