White/Caucasian vs Menominee Disability Age 65 to 74
COMPARE
White/Caucasian
Menominee
Disability Age 65 to 74
Disability Age 65 to 74 Comparison
Whites/Caucasians
Menominee
24.2%
DISABILITY AGE 65 TO 74
6.6/ 100
METRIC RATING
228th/ 347
METRIC RANK
27.4%
DISABILITY AGE 65 TO 74
0.0/ 100
METRIC RATING
311th/ 347
METRIC RANK
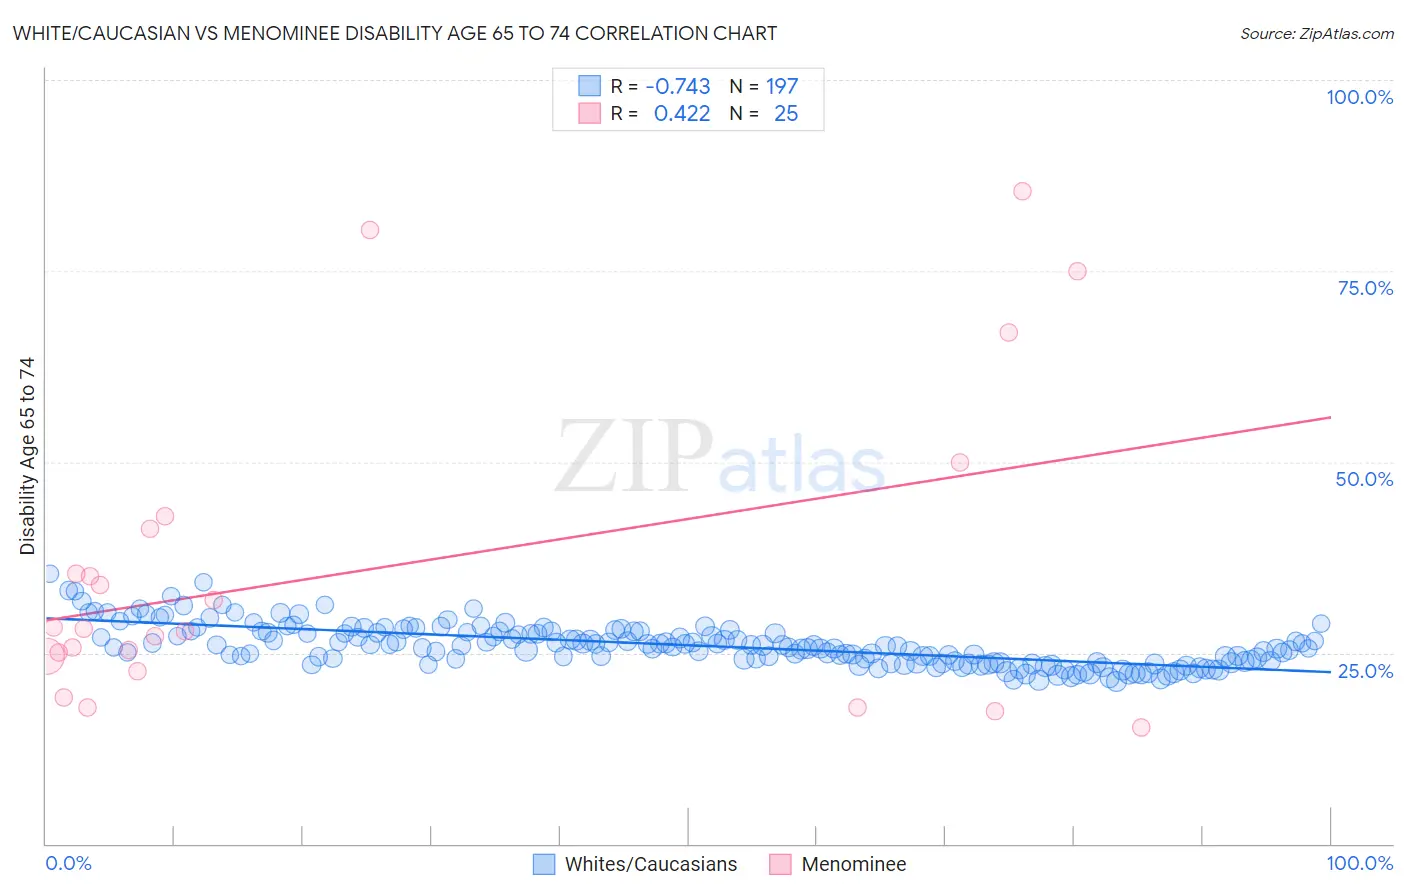
White/Caucasian vs Menominee Disability Age 65 to 74 Correlation Chart
The statistical analysis conducted on geographies consisting of 580,018,355 people shows a strong negative correlation between the proportion of Whites/Caucasians and percentage of population with a disability between the ages 65 and 75 in the United States with a correlation coefficient (R) of -0.743 and weighted average of 24.2%. Similarly, the statistical analysis conducted on geographies consisting of 45,777,170 people shows a moderate positive correlation between the proportion of Menominee and percentage of population with a disability between the ages 65 and 75 in the United States with a correlation coefficient (R) of 0.422 and weighted average of 27.4%, a difference of 13.2%.
Disability Age 65 to 74 Correlation Summary
| Measurement | White/Caucasian | Menominee |
| Minimum | 21.3% | 15.2% |
| Maximum | 35.4% | 85.4% |
| Range | 14.1% | 70.3% |
| Mean | 26.0% | 36.0% |
| Median | 25.8% | 28.1% |
| Interquartile 25% (IQ1) | 23.7% | 23.6% |
| Interquartile 75% (IQ3) | 27.7% | 42.1% |
| Interquartile Range (IQR) | 4.0% | 18.5% |
| Standard Deviation (Sample) | 2.7% | 20.2% |
| Standard Deviation (Population) | 2.7% | 19.8% |
Similar Demographics by Disability Age 65 to 74
Demographics Similar to Whites/Caucasians by Disability Age 65 to 74
In terms of disability age 65 to 74, the demographic groups most similar to Whites/Caucasians are Celtic (24.2%, a difference of 0.050%), Barbadian (24.3%, a difference of 0.16%), Nigerian (24.2%, a difference of 0.25%), Iraqi (24.2%, a difference of 0.31%), and Bermudan (24.2%, a difference of 0.32%).
| Demographics | Rating | Rank | Disability Age 65 to 74 |
| Immigrants | Nicaragua | 9.8 /100 | #221 | Tragic 24.1% |
| Native Hawaiians | 9.3 /100 | #222 | Tragic 24.1% |
| Immigrants | Middle Africa | 8.9 /100 | #223 | Tragic 24.1% |
| Immigrants | Panama | 8.6 /100 | #224 | Tragic 24.1% |
| Bermudans | 8.2 /100 | #225 | Tragic 24.2% |
| Iraqis | 8.1 /100 | #226 | Tragic 24.2% |
| Nigerians | 7.8 /100 | #227 | Tragic 24.2% |
| Whites/Caucasians | 6.6 /100 | #228 | Tragic 24.2% |
| Celtics | 6.4 /100 | #229 | Tragic 24.2% |
| Barbadians | 6.0 /100 | #230 | Tragic 24.3% |
| Immigrants | Thailand | 5.2 /100 | #231 | Tragic 24.3% |
| Immigrants | Zaire | 5.0 /100 | #232 | Tragic 24.3% |
| Bahamians | 4.5 /100 | #233 | Tragic 24.4% |
| Panamanians | 4.2 /100 | #234 | Tragic 24.4% |
| Scotch-Irish | 3.8 /100 | #235 | Tragic 24.4% |
Demographics Similar to Menominee by Disability Age 65 to 74
In terms of disability age 65 to 74, the demographic groups most similar to Menominee are Osage (27.5%, a difference of 0.080%), Shoshone (27.4%, a difference of 0.23%), Yaqui (27.4%, a difference of 0.27%), Sioux (27.3%, a difference of 0.34%), and Ute (27.3%, a difference of 0.49%).
| Demographics | Rating | Rank | Disability Age 65 to 74 |
| Puget Sound Salish | 0.0 /100 | #304 | Tragic 27.2% |
| Mexicans | 0.0 /100 | #305 | Tragic 27.2% |
| Blacks/African Americans | 0.0 /100 | #306 | Tragic 27.3% |
| Ute | 0.0 /100 | #307 | Tragic 27.3% |
| Sioux | 0.0 /100 | #308 | Tragic 27.3% |
| Yaqui | 0.0 /100 | #309 | Tragic 27.4% |
| Shoshone | 0.0 /100 | #310 | Tragic 27.4% |
| Menominee | 0.0 /100 | #311 | Tragic 27.4% |
| Osage | 0.0 /100 | #312 | Tragic 27.5% |
| Paiute | 0.0 /100 | #313 | Tragic 27.8% |
| Chippewa | 0.0 /100 | #314 | Tragic 27.8% |
| Cajuns | 0.0 /100 | #315 | Tragic 27.9% |
| Crow | 0.0 /100 | #316 | Tragic 27.9% |
| Immigrants | Armenia | 0.0 /100 | #317 | Tragic 28.0% |
| Nepalese | 0.0 /100 | #318 | Tragic 28.0% |