Immigrants from Burma/Myanmar vs Arab Disability Age 65 to 74
COMPARE
Immigrants from Burma/Myanmar
Arab
Disability Age 65 to 74
Disability Age 65 to 74 Comparison
Immigrants from Burma/Myanmar
Arabs
24.0%
DISABILITY AGE 65 TO 74
11.6/ 100
METRIC RATING
219th/ 347
METRIC RANK
22.8%
DISABILITY AGE 65 TO 74
84.8/ 100
METRIC RATING
143rd/ 347
METRIC RANK
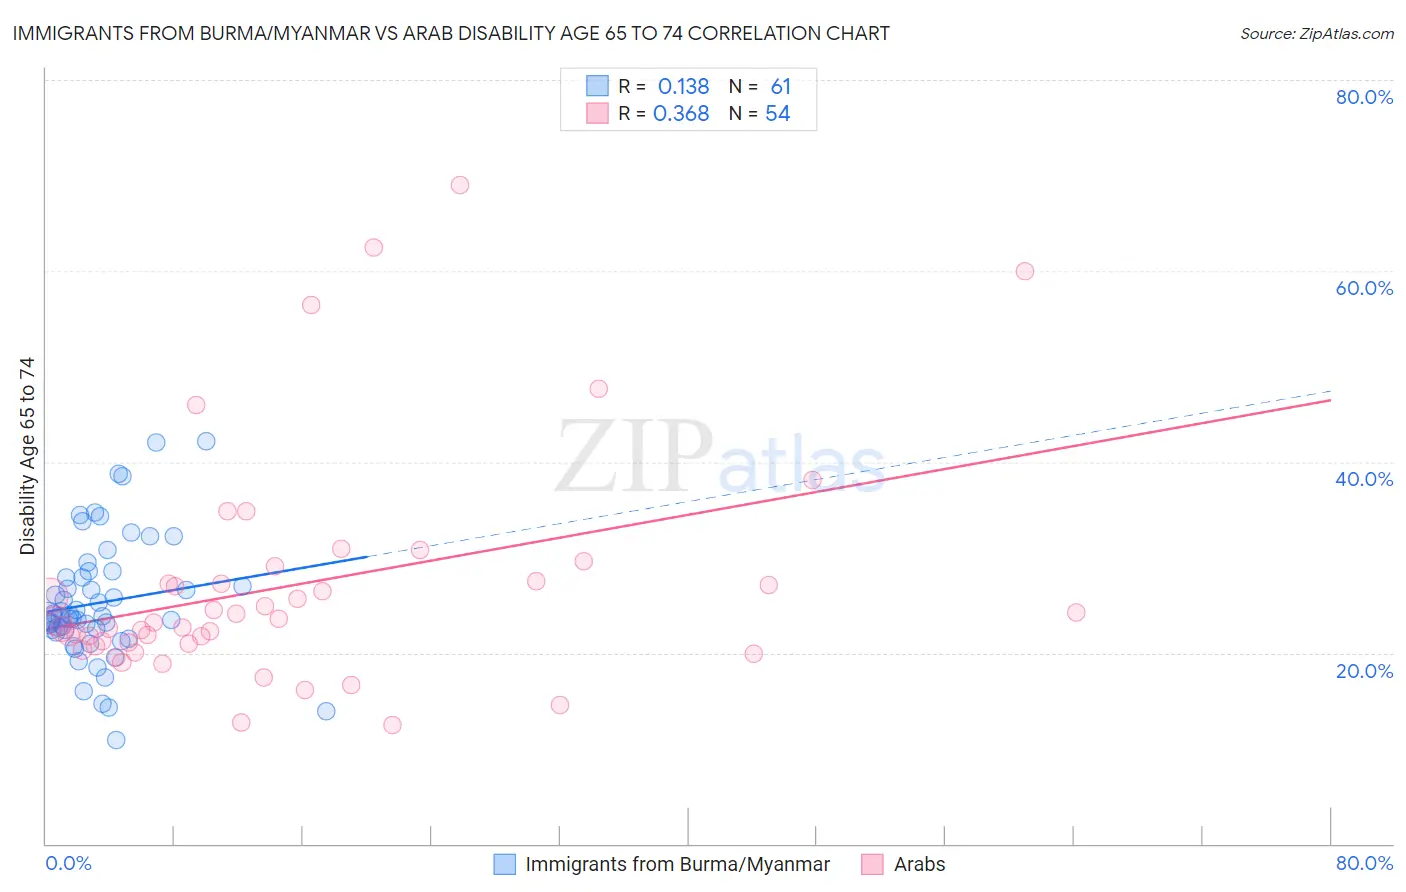
Immigrants from Burma/Myanmar vs Arab Disability Age 65 to 74 Correlation Chart
The statistical analysis conducted on geographies consisting of 172,172,101 people shows a poor positive correlation between the proportion of Immigrants from Burma/Myanmar and percentage of population with a disability between the ages 65 and 75 in the United States with a correlation coefficient (R) of 0.138 and weighted average of 24.0%. Similarly, the statistical analysis conducted on geographies consisting of 485,549,986 people shows a mild positive correlation between the proportion of Arabs and percentage of population with a disability between the ages 65 and 75 in the United States with a correlation coefficient (R) of 0.368 and weighted average of 22.8%, a difference of 5.6%.
Disability Age 65 to 74 Correlation Summary
| Measurement | Immigrants from Burma/Myanmar | Arab |
| Minimum | 10.8% | 12.5% |
| Maximum | 42.1% | 69.0% |
| Range | 31.3% | 56.5% |
| Mean | 25.3% | 27.1% |
| Median | 23.9% | 23.3% |
| Interquartile 25% (IQ1) | 22.3% | 21.0% |
| Interquartile 75% (IQ3) | 28.3% | 27.5% |
| Interquartile Range (IQR) | 6.0% | 6.5% |
| Standard Deviation (Sample) | 6.5% | 12.1% |
| Standard Deviation (Population) | 6.4% | 12.0% |
Similar Demographics by Disability Age 65 to 74
Demographics Similar to Immigrants from Burma/Myanmar by Disability Age 65 to 74
In terms of disability age 65 to 74, the demographic groups most similar to Immigrants from Burma/Myanmar are Immigrants from Portugal (24.0%, a difference of 0.020%), Immigrants from Nigeria (24.0%, a difference of 0.020%), Jamaican (24.0%, a difference of 0.090%), Ghanaian (24.1%, a difference of 0.18%), and Pennsylvania German (24.0%, a difference of 0.22%).
| Demographics | Rating | Rank | Disability Age 65 to 74 |
| French | 15.7 /100 | #212 | Poor 23.9% |
| Nicaraguans | 14.3 /100 | #213 | Poor 23.9% |
| Immigrants | Oceania | 13.6 /100 | #214 | Poor 24.0% |
| Pennsylvania Germans | 13.3 /100 | #215 | Poor 24.0% |
| Jamaicans | 12.2 /100 | #216 | Poor 24.0% |
| Immigrants | Portugal | 11.7 /100 | #217 | Poor 24.0% |
| Immigrants | Nigeria | 11.7 /100 | #218 | Poor 24.0% |
| Immigrants | Burma/Myanmar | 11.6 /100 | #219 | Poor 24.0% |
| Ghanaians | 10.4 /100 | #220 | Poor 24.1% |
| Immigrants | Nicaragua | 9.8 /100 | #221 | Tragic 24.1% |
| Native Hawaiians | 9.3 /100 | #222 | Tragic 24.1% |
| Immigrants | Middle Africa | 8.9 /100 | #223 | Tragic 24.1% |
| Immigrants | Panama | 8.6 /100 | #224 | Tragic 24.1% |
| Bermudans | 8.2 /100 | #225 | Tragic 24.2% |
| Iraqis | 8.1 /100 | #226 | Tragic 24.2% |
Demographics Similar to Arabs by Disability Age 65 to 74
In terms of disability age 65 to 74, the demographic groups most similar to Arabs are Danish (22.8%, a difference of 0.040%), Immigrants from Ethiopia (22.7%, a difference of 0.060%), Belgian (22.7%, a difference of 0.070%), Ugandan (22.7%, a difference of 0.080%), and Immigrants from Uganda (22.8%, a difference of 0.080%).
| Demographics | Rating | Rank | Disability Age 65 to 74 |
| Ethiopians | 87.9 /100 | #136 | Excellent 22.7% |
| Taiwanese | 87.6 /100 | #137 | Excellent 22.7% |
| Immigrants | Moldova | 87.3 /100 | #138 | Excellent 22.7% |
| Immigrants | Syria | 85.8 /100 | #139 | Excellent 22.7% |
| Ugandans | 85.4 /100 | #140 | Excellent 22.7% |
| Belgians | 85.3 /100 | #141 | Excellent 22.7% |
| Immigrants | Ethiopia | 85.3 /100 | #142 | Excellent 22.7% |
| Arabs | 84.8 /100 | #143 | Excellent 22.8% |
| Danes | 84.4 /100 | #144 | Excellent 22.8% |
| Immigrants | Uganda | 84.0 /100 | #145 | Excellent 22.8% |
| Alsatians | 83.7 /100 | #146 | Excellent 22.8% |
| Immigrants | Uzbekistan | 83.1 /100 | #147 | Excellent 22.8% |
| New Zealanders | 79.9 /100 | #148 | Good 22.9% |
| Swiss | 79.7 /100 | #149 | Good 22.9% |
| Canadians | 77.7 /100 | #150 | Good 22.9% |