Immigrants from Burma/Myanmar vs Lithuanian Disability Age 65 to 74
COMPARE
Immigrants from Burma/Myanmar
Lithuanian
Disability Age 65 to 74
Disability Age 65 to 74 Comparison
Immigrants from Burma/Myanmar
Lithuanians
24.0%
DISABILITY AGE 65 TO 74
11.6/ 100
METRIC RATING
219th/ 347
METRIC RANK
21.4%
DISABILITY AGE 65 TO 74
99.7/ 100
METRIC RATING
48th/ 347
METRIC RANK
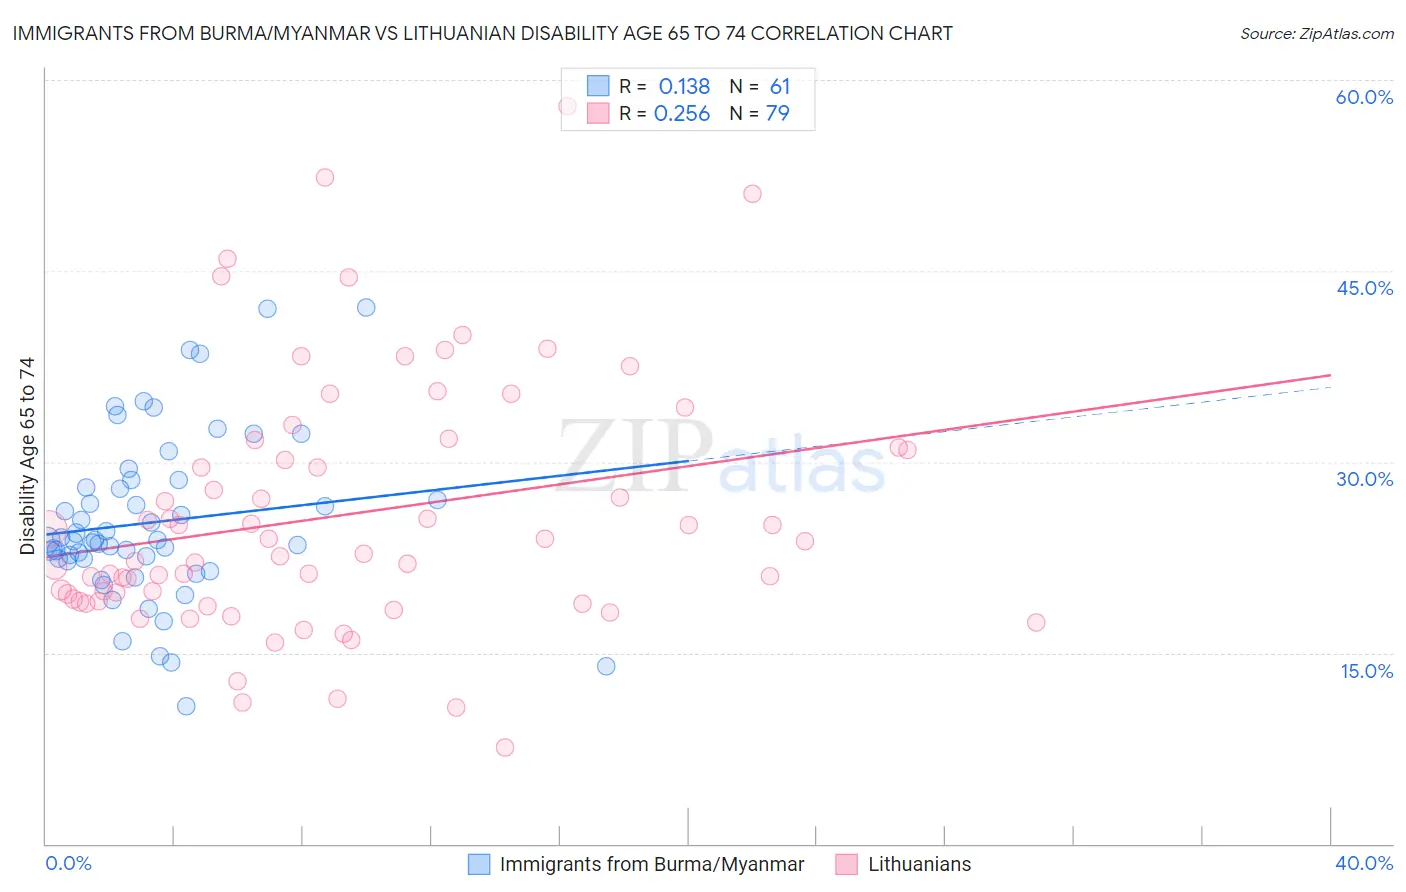
Immigrants from Burma/Myanmar vs Lithuanian Disability Age 65 to 74 Correlation Chart
The statistical analysis conducted on geographies consisting of 172,172,101 people shows a poor positive correlation between the proportion of Immigrants from Burma/Myanmar and percentage of population with a disability between the ages 65 and 75 in the United States with a correlation coefficient (R) of 0.138 and weighted average of 24.0%. Similarly, the statistical analysis conducted on geographies consisting of 421,207,937 people shows a weak positive correlation between the proportion of Lithuanians and percentage of population with a disability between the ages 65 and 75 in the United States with a correlation coefficient (R) of 0.256 and weighted average of 21.4%, a difference of 12.3%.
Disability Age 65 to 74 Correlation Summary
| Measurement | Immigrants from Burma/Myanmar | Lithuanian |
| Minimum | 10.8% | 7.6% |
| Maximum | 42.1% | 57.9% |
| Range | 31.3% | 50.3% |
| Mean | 25.3% | 25.8% |
| Median | 23.9% | 22.8% |
| Interquartile 25% (IQ1) | 22.3% | 19.1% |
| Interquartile 75% (IQ3) | 28.3% | 31.1% |
| Interquartile Range (IQR) | 6.0% | 12.0% |
| Standard Deviation (Sample) | 6.5% | 9.9% |
| Standard Deviation (Population) | 6.4% | 9.9% |
Similar Demographics by Disability Age 65 to 74
Demographics Similar to Immigrants from Burma/Myanmar by Disability Age 65 to 74
In terms of disability age 65 to 74, the demographic groups most similar to Immigrants from Burma/Myanmar are Immigrants from Portugal (24.0%, a difference of 0.020%), Immigrants from Nigeria (24.0%, a difference of 0.020%), Jamaican (24.0%, a difference of 0.090%), Ghanaian (24.1%, a difference of 0.18%), and Pennsylvania German (24.0%, a difference of 0.22%).
| Demographics | Rating | Rank | Disability Age 65 to 74 |
| French | 15.7 /100 | #212 | Poor 23.9% |
| Nicaraguans | 14.3 /100 | #213 | Poor 23.9% |
| Immigrants | Oceania | 13.6 /100 | #214 | Poor 24.0% |
| Pennsylvania Germans | 13.3 /100 | #215 | Poor 24.0% |
| Jamaicans | 12.2 /100 | #216 | Poor 24.0% |
| Immigrants | Portugal | 11.7 /100 | #217 | Poor 24.0% |
| Immigrants | Nigeria | 11.7 /100 | #218 | Poor 24.0% |
| Immigrants | Burma/Myanmar | 11.6 /100 | #219 | Poor 24.0% |
| Ghanaians | 10.4 /100 | #220 | Poor 24.1% |
| Immigrants | Nicaragua | 9.8 /100 | #221 | Tragic 24.1% |
| Native Hawaiians | 9.3 /100 | #222 | Tragic 24.1% |
| Immigrants | Middle Africa | 8.9 /100 | #223 | Tragic 24.1% |
| Immigrants | Panama | 8.6 /100 | #224 | Tragic 24.1% |
| Bermudans | 8.2 /100 | #225 | Tragic 24.2% |
| Iraqis | 8.1 /100 | #226 | Tragic 24.2% |
Demographics Similar to Lithuanians by Disability Age 65 to 74
In terms of disability age 65 to 74, the demographic groups most similar to Lithuanians are Luxembourger (21.4%, a difference of 0.010%), Immigrants from Malaysia (21.4%, a difference of 0.030%), Immigrants from Turkey (21.4%, a difference of 0.050%), Immigrants from Bulgaria (21.4%, a difference of 0.050%), and Asian (21.4%, a difference of 0.080%).
| Demographics | Rating | Rank | Disability Age 65 to 74 |
| Immigrants | Austria | 99.8 /100 | #41 | Exceptional 21.2% |
| Macedonians | 99.7 /100 | #42 | Exceptional 21.3% |
| Immigrants | Croatia | 99.7 /100 | #43 | Exceptional 21.3% |
| Estonians | 99.7 /100 | #44 | Exceptional 21.4% |
| Asians | 99.7 /100 | #45 | Exceptional 21.4% |
| Immigrants | Turkey | 99.7 /100 | #46 | Exceptional 21.4% |
| Immigrants | Bulgaria | 99.7 /100 | #47 | Exceptional 21.4% |
| Lithuanians | 99.7 /100 | #48 | Exceptional 21.4% |
| Luxembourgers | 99.7 /100 | #49 | Exceptional 21.4% |
| Immigrants | Malaysia | 99.7 /100 | #50 | Exceptional 21.4% |
| Immigrants | Serbia | 99.6 /100 | #51 | Exceptional 21.4% |
| Immigrants | France | 99.6 /100 | #52 | Exceptional 21.5% |
| Bhutanese | 99.6 /100 | #53 | Exceptional 21.5% |
| Immigrants | Italy | 99.6 /100 | #54 | Exceptional 21.5% |
| Immigrants | Romania | 99.5 /100 | #55 | Exceptional 21.5% |