Immigrants from Burma/Myanmar vs Ecuadorian Vision Disability
COMPARE
Immigrants from Burma/Myanmar
Ecuadorian
Vision Disability
Vision Disability Comparison
Immigrants from Burma/Myanmar
Ecuadorians
2.2%
VISION DISABILITY
37.9/ 100
METRIC RATING
183rd/ 347
METRIC RANK
2.3%
VISION DISABILITY
4.6/ 100
METRIC RATING
219th/ 347
METRIC RANK
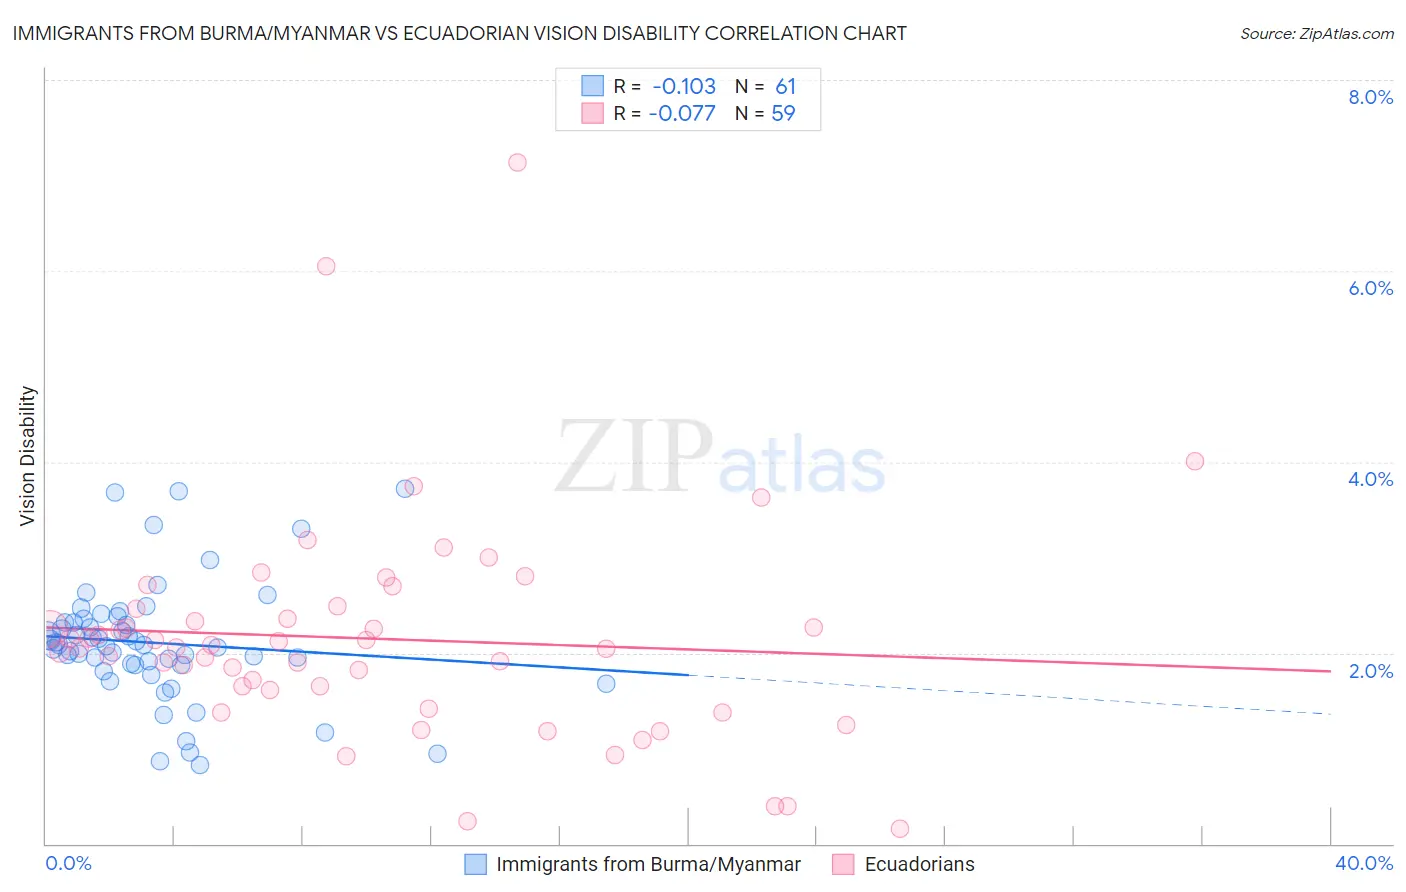
Immigrants from Burma/Myanmar vs Ecuadorian Vision Disability Correlation Chart
The statistical analysis conducted on geographies consisting of 172,315,861 people shows a poor negative correlation between the proportion of Immigrants from Burma/Myanmar and percentage of population with vision disability in the United States with a correlation coefficient (R) of -0.103 and weighted average of 2.2%. Similarly, the statistical analysis conducted on geographies consisting of 317,586,647 people shows a slight negative correlation between the proportion of Ecuadorians and percentage of population with vision disability in the United States with a correlation coefficient (R) of -0.077 and weighted average of 2.3%, a difference of 4.0%.
Vision Disability Correlation Summary
| Measurement | Immigrants from Burma/Myanmar | Ecuadorian |
| Minimum | 0.83% | 0.16% |
| Maximum | 3.7% | 7.1% |
| Range | 2.9% | 7.0% |
| Mean | 2.1% | 2.1% |
| Median | 2.1% | 2.1% |
| Interquartile 25% (IQ1) | 1.9% | 1.6% |
| Interquartile 75% (IQ3) | 2.3% | 2.5% |
| Interquartile Range (IQR) | 0.47% | 0.85% |
| Standard Deviation (Sample) | 0.62% | 1.2% |
| Standard Deviation (Population) | 0.62% | 1.2% |
Similar Demographics by Vision Disability
Demographics Similar to Immigrants from Burma/Myanmar by Vision Disability
In terms of vision disability, the demographic groups most similar to Immigrants from Burma/Myanmar are Moroccan (2.2%, a difference of 0.17%), Costa Rican (2.2%, a difference of 0.19%), Immigrants from Western Europe (2.2%, a difference of 0.21%), Immigrants from Middle Africa (2.2%, a difference of 0.30%), and Uruguayan (2.2%, a difference of 0.31%).
| Demographics | Rating | Rank | Vision Disability |
| Yugoslavians | 46.5 /100 | #176 | Average 2.2% |
| Slavs | 46.0 /100 | #177 | Average 2.2% |
| Immigrants | Oceania | 45.1 /100 | #178 | Average 2.2% |
| Immigrants | North America | 44.5 /100 | #179 | Average 2.2% |
| Uruguayans | 42.7 /100 | #180 | Average 2.2% |
| Immigrants | Western Europe | 41.1 /100 | #181 | Average 2.2% |
| Costa Ricans | 40.7 /100 | #182 | Average 2.2% |
| Immigrants | Burma/Myanmar | 37.9 /100 | #183 | Fair 2.2% |
| Moroccans | 35.4 /100 | #184 | Fair 2.2% |
| Immigrants | Middle Africa | 33.5 /100 | #185 | Fair 2.2% |
| Native Hawaiians | 33.3 /100 | #186 | Fair 2.2% |
| Immigrants | St. Vincent and the Grenadines | 30.3 /100 | #187 | Fair 2.2% |
| Guyanese | 28.9 /100 | #188 | Fair 2.2% |
| Salvadorans | 27.4 /100 | #189 | Fair 2.2% |
| Immigrants | Costa Rica | 26.1 /100 | #190 | Fair 2.2% |
Demographics Similar to Ecuadorians by Vision Disability
In terms of vision disability, the demographic groups most similar to Ecuadorians are Portuguese (2.3%, a difference of 0.11%), Barbadian (2.3%, a difference of 0.17%), Guamanian/Chamorro (2.3%, a difference of 0.24%), French Canadian (2.3%, a difference of 0.25%), and Immigrants from Senegal (2.3%, a difference of 0.27%).
| Demographics | Rating | Rank | Vision Disability |
| Bermudans | 9.0 /100 | #212 | Tragic 2.2% |
| Immigrants | Ghana | 8.9 /100 | #213 | Tragic 2.2% |
| Trinidadians and Tobagonians | 8.2 /100 | #214 | Tragic 2.2% |
| Nigerians | 7.2 /100 | #215 | Tragic 2.3% |
| Immigrants | Trinidad and Tobago | 6.1 /100 | #216 | Tragic 2.3% |
| Barbadians | 5.1 /100 | #217 | Tragic 2.3% |
| Portuguese | 4.9 /100 | #218 | Tragic 2.3% |
| Ecuadorians | 4.6 /100 | #219 | Tragic 2.3% |
| Guamanians/Chamorros | 3.9 /100 | #220 | Tragic 2.3% |
| French Canadians | 3.9 /100 | #221 | Tragic 2.3% |
| Immigrants | Senegal | 3.8 /100 | #222 | Tragic 2.3% |
| Basques | 3.5 /100 | #223 | Tragic 2.3% |
| Irish | 3.4 /100 | #224 | Tragic 2.3% |
| Immigrants | Western Africa | 3.4 /100 | #225 | Tragic 2.3% |
| Immigrants | Germany | 3.0 /100 | #226 | Tragic 2.3% |