Immigrants from Burma/Myanmar vs Immigrants from Chile Vision Disability
COMPARE
Immigrants from Burma/Myanmar
Immigrants from Chile
Vision Disability
Vision Disability Comparison
Immigrants from Burma/Myanmar
Immigrants from Chile
2.2%
VISION DISABILITY
37.9/ 100
METRIC RATING
183rd/ 347
METRIC RANK
2.1%
VISION DISABILITY
89.0/ 100
METRIC RATING
128th/ 347
METRIC RANK
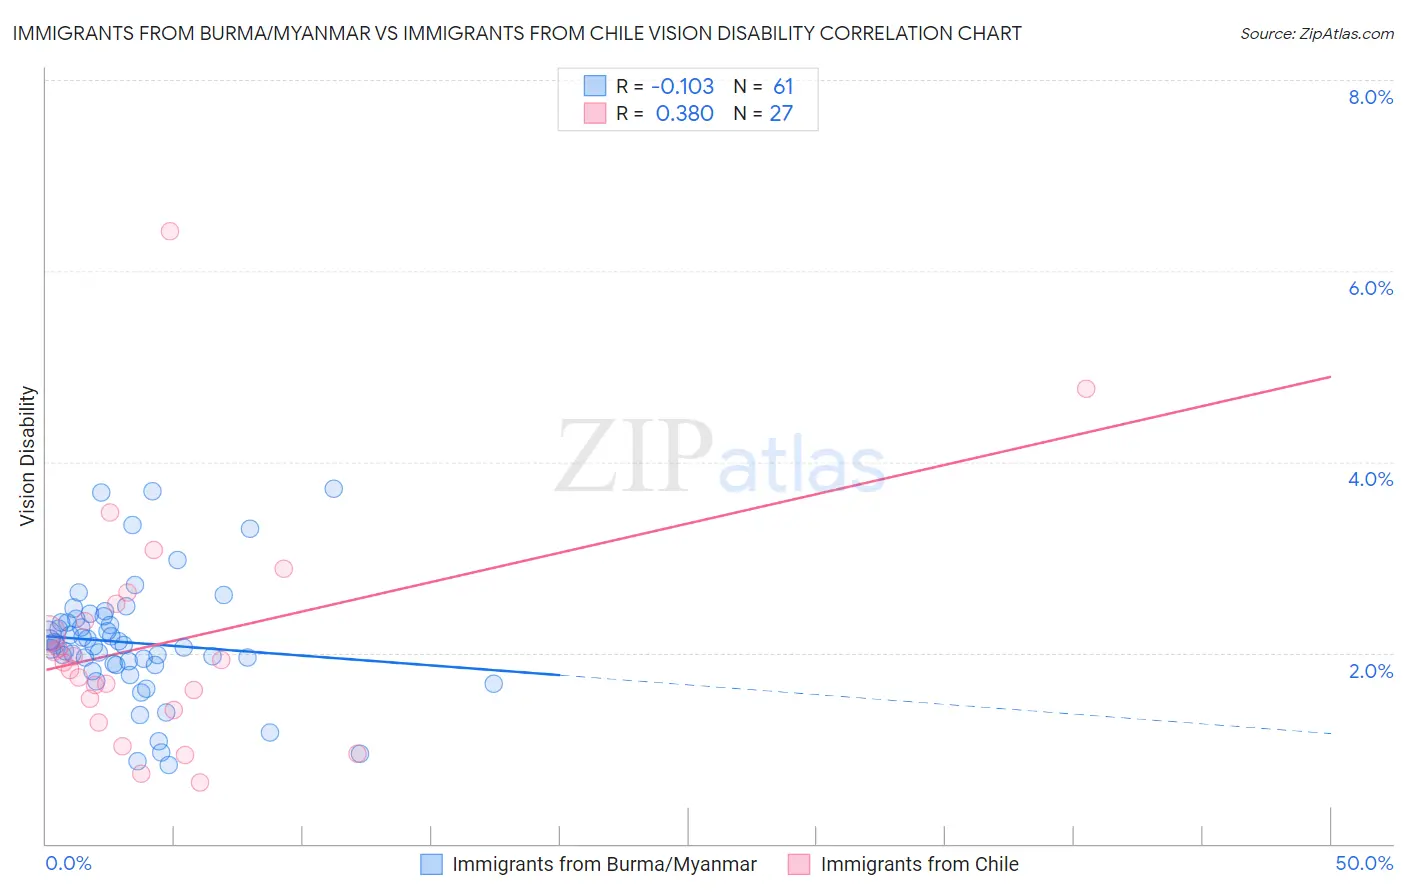
Immigrants from Burma/Myanmar vs Immigrants from Chile Vision Disability Correlation Chart
The statistical analysis conducted on geographies consisting of 172,315,861 people shows a poor negative correlation between the proportion of Immigrants from Burma/Myanmar and percentage of population with vision disability in the United States with a correlation coefficient (R) of -0.103 and weighted average of 2.2%. Similarly, the statistical analysis conducted on geographies consisting of 218,580,502 people shows a mild positive correlation between the proportion of Immigrants from Chile and percentage of population with vision disability in the United States with a correlation coefficient (R) of 0.380 and weighted average of 2.1%, a difference of 4.2%.
Vision Disability Correlation Summary
| Measurement | Immigrants from Burma/Myanmar | Immigrants from Chile |
| Minimum | 0.83% | 0.64% |
| Maximum | 3.7% | 6.4% |
| Range | 2.9% | 5.8% |
| Mean | 2.1% | 2.1% |
| Median | 2.1% | 1.9% |
| Interquartile 25% (IQ1) | 1.9% | 1.4% |
| Interquartile 75% (IQ3) | 2.3% | 2.5% |
| Interquartile Range (IQR) | 0.47% | 1.1% |
| Standard Deviation (Sample) | 0.62% | 1.2% |
| Standard Deviation (Population) | 0.62% | 1.2% |
Similar Demographics by Vision Disability
Demographics Similar to Immigrants from Burma/Myanmar by Vision Disability
In terms of vision disability, the demographic groups most similar to Immigrants from Burma/Myanmar are Moroccan (2.2%, a difference of 0.17%), Costa Rican (2.2%, a difference of 0.19%), Immigrants from Western Europe (2.2%, a difference of 0.21%), Immigrants from Middle Africa (2.2%, a difference of 0.30%), and Uruguayan (2.2%, a difference of 0.31%).
| Demographics | Rating | Rank | Vision Disability |
| Yugoslavians | 46.5 /100 | #176 | Average 2.2% |
| Slavs | 46.0 /100 | #177 | Average 2.2% |
| Immigrants | Oceania | 45.1 /100 | #178 | Average 2.2% |
| Immigrants | North America | 44.5 /100 | #179 | Average 2.2% |
| Uruguayans | 42.7 /100 | #180 | Average 2.2% |
| Immigrants | Western Europe | 41.1 /100 | #181 | Average 2.2% |
| Costa Ricans | 40.7 /100 | #182 | Average 2.2% |
| Immigrants | Burma/Myanmar | 37.9 /100 | #183 | Fair 2.2% |
| Moroccans | 35.4 /100 | #184 | Fair 2.2% |
| Immigrants | Middle Africa | 33.5 /100 | #185 | Fair 2.2% |
| Native Hawaiians | 33.3 /100 | #186 | Fair 2.2% |
| Immigrants | St. Vincent and the Grenadines | 30.3 /100 | #187 | Fair 2.2% |
| Guyanese | 28.9 /100 | #188 | Fair 2.2% |
| Salvadorans | 27.4 /100 | #189 | Fair 2.2% |
| Immigrants | Costa Rica | 26.1 /100 | #190 | Fair 2.2% |
Demographics Similar to Immigrants from Chile by Vision Disability
In terms of vision disability, the demographic groups most similar to Immigrants from Chile are Sudanese (2.1%, a difference of 0.030%), Immigrants from Cameroon (2.1%, a difference of 0.030%), Immigrants from Kenya (2.1%, a difference of 0.040%), Immigrants from Hungary (2.1%, a difference of 0.050%), and Immigrants from Peru (2.1%, a difference of 0.10%).
| Demographics | Rating | Rank | Vision Disability |
| Immigrants | Scotland | 90.4 /100 | #121 | Exceptional 2.1% |
| Immigrants | Ukraine | 90.4 /100 | #122 | Exceptional 2.1% |
| Immigrants | Albania | 90.4 /100 | #123 | Exceptional 2.1% |
| Immigrants | Spain | 89.8 /100 | #124 | Excellent 2.1% |
| Immigrants | Venezuela | 89.8 /100 | #125 | Excellent 2.1% |
| Immigrants | Peru | 89.5 /100 | #126 | Excellent 2.1% |
| Sudanese | 89.2 /100 | #127 | Excellent 2.1% |
| Immigrants | Chile | 89.0 /100 | #128 | Excellent 2.1% |
| Immigrants | Cameroon | 88.8 /100 | #129 | Excellent 2.1% |
| Immigrants | Kenya | 88.7 /100 | #130 | Excellent 2.1% |
| Immigrants | Hungary | 88.7 /100 | #131 | Excellent 2.1% |
| New Zealanders | 88.2 /100 | #132 | Excellent 2.1% |
| Syrians | 87.5 /100 | #133 | Excellent 2.1% |
| Venezuelans | 87.2 /100 | #134 | Excellent 2.1% |
| Vietnamese | 86.7 /100 | #135 | Excellent 2.1% |