Immigrants from Burma/Myanmar vs Filipino 1 or more Vehicles in Household
COMPARE
Immigrants from Burma/Myanmar
Filipino
1 or more Vehicles in Household
1 or more Vehicles in Household Comparison
Immigrants from Burma/Myanmar
Filipinos
89.7%
1 OR MORE VEHICLES IN HOUSEHOLD
47.6/ 100
METRIC RATING
175th/ 347
METRIC RANK
89.7%
1 OR MORE VEHICLES IN HOUSEHOLD
50.0/ 100
METRIC RATING
174th/ 347
METRIC RANK
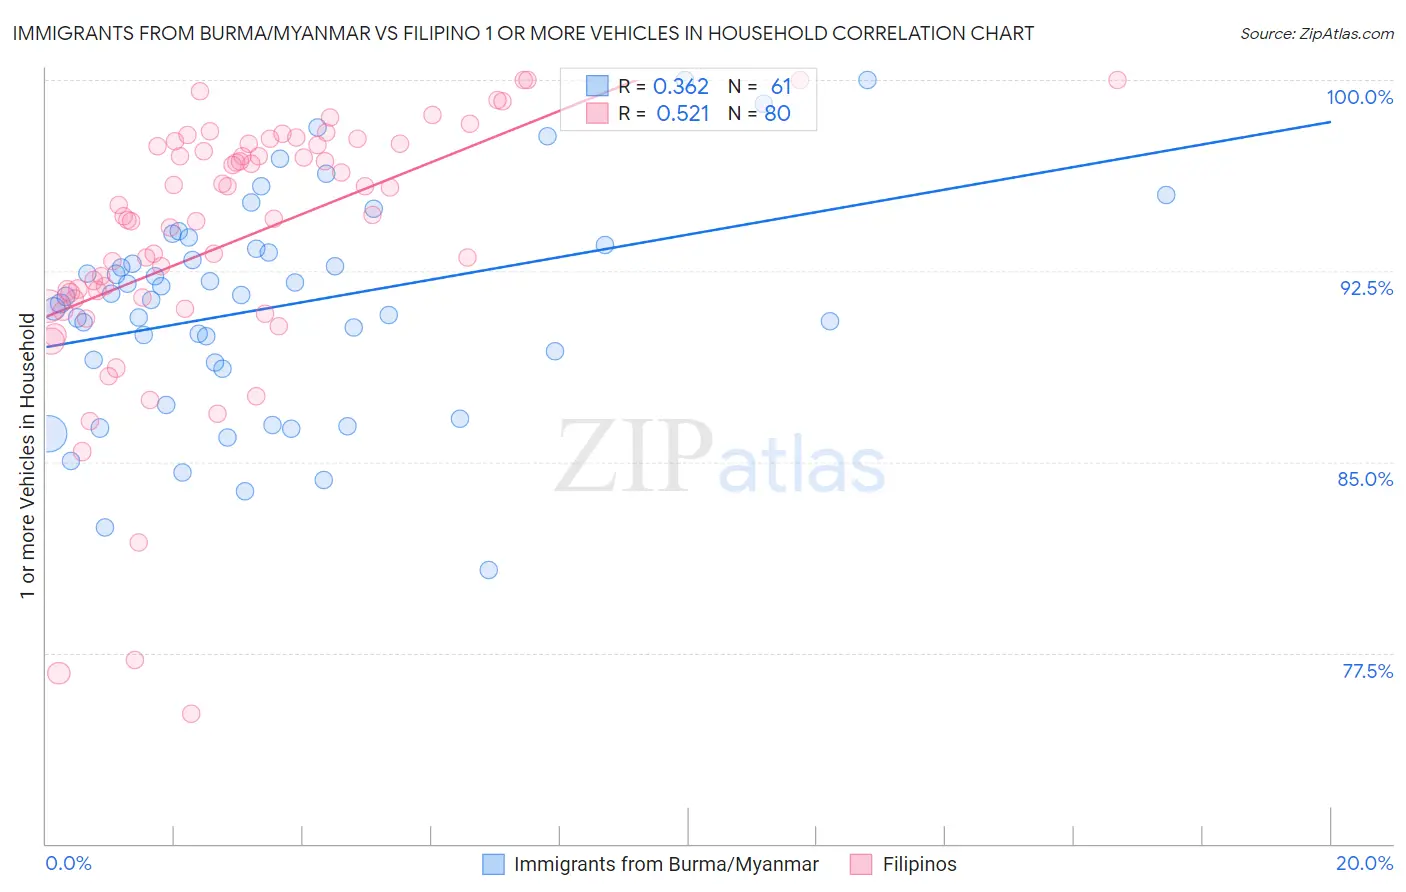
Immigrants from Burma/Myanmar vs Filipino 1 or more Vehicles in Household Correlation Chart
The statistical analysis conducted on geographies consisting of 172,231,522 people shows a mild positive correlation between the proportion of Immigrants from Burma/Myanmar and percentage of households with 1 or more vehicles available in the United States with a correlation coefficient (R) of 0.362 and weighted average of 89.7%. Similarly, the statistical analysis conducted on geographies consisting of 254,177,454 people shows a substantial positive correlation between the proportion of Filipinos and percentage of households with 1 or more vehicles available in the United States with a correlation coefficient (R) of 0.521 and weighted average of 89.7%, a difference of 0.040%.
1 or more Vehicles in Household Correlation Summary
| Measurement | Immigrants from Burma/Myanmar | Filipino |
| Minimum | 80.7% | 75.1% |
| Maximum | 100.0% | 100.0% |
| Range | 19.3% | 24.9% |
| Mean | 91.1% | 93.7% |
| Median | 91.5% | 94.7% |
| Interquartile 25% (IQ1) | 88.8% | 91.4% |
| Interquartile 75% (IQ3) | 93.5% | 97.5% |
| Interquartile Range (IQR) | 4.7% | 6.0% |
| Standard Deviation (Sample) | 4.2% | 5.2% |
| Standard Deviation (Population) | 4.2% | 5.1% |
Demographics Similar to Immigrants from Burma/Myanmar and Filipinos by 1 or more Vehicles in Household
In terms of 1 or more vehicles in household, the demographic groups most similar to Immigrants from Burma/Myanmar are Immigrants from Sudan (89.7%, a difference of 0.010%), Hmong (89.6%, a difference of 0.030%), Immigrants from El Salvador (89.6%, a difference of 0.050%), German Russian (89.6%, a difference of 0.060%), and Arab (89.6%, a difference of 0.070%). Similarly, the demographic groups most similar to Filipinos are Lumbee (89.7%, a difference of 0.040%), Indonesian (89.7%, a difference of 0.050%), Immigrants from Sudan (89.7%, a difference of 0.050%), French American Indian (89.8%, a difference of 0.070%), and Hmong (89.6%, a difference of 0.070%).
| Demographics | Rating | Rank | 1 or more Vehicles in Household |
| Comanche | 63.4 /100 | #164 | Good 89.9% |
| Immigrants | Saudi Arabia | 62.6 /100 | #165 | Good 89.9% |
| Immigrants | Middle Africa | 62.2 /100 | #166 | Good 89.9% |
| Immigrants | Latin America | 60.3 /100 | #167 | Good 89.8% |
| Immigrants | Cambodia | 60.1 /100 | #168 | Good 89.8% |
| Natives/Alaskans | 59.5 /100 | #169 | Average 89.8% |
| Immigrants | Costa Rica | 57.6 /100 | #170 | Average 89.8% |
| French American Indians | 54.4 /100 | #171 | Average 89.8% |
| Indonesians | 53.0 /100 | #172 | Average 89.7% |
| Lumbee | 52.8 /100 | #173 | Average 89.7% |
| Filipinos | 50.0 /100 | #174 | Average 89.7% |
| Immigrants | Burma/Myanmar | 47.6 /100 | #175 | Average 89.7% |
| Immigrants | Sudan | 47.1 /100 | #176 | Average 89.7% |
| Hmong | 45.8 /100 | #177 | Average 89.6% |
| Immigrants | El Salvador | 44.1 /100 | #178 | Average 89.6% |
| German Russians | 44.0 /100 | #179 | Average 89.6% |
| Arabs | 43.3 /100 | #180 | Average 89.6% |
| Immigrants | Ethiopia | 42.5 /100 | #181 | Average 89.6% |
| Ukrainians | 42.4 /100 | #182 | Average 89.6% |
| Ethiopians | 41.2 /100 | #183 | Average 89.6% |
| Immigrants | Bulgaria | 40.7 /100 | #184 | Average 89.6% |