Soviet Union vs Ecuadorian Vision Disability
COMPARE
Soviet Union
Ecuadorian
Vision Disability
Vision Disability Comparison
Soviet Union
Ecuadorians
2.0%
VISION DISABILITY
97.6/ 100
METRIC RATING
81st/ 347
METRIC RANK
2.3%
VISION DISABILITY
4.6/ 100
METRIC RATING
219th/ 347
METRIC RANK
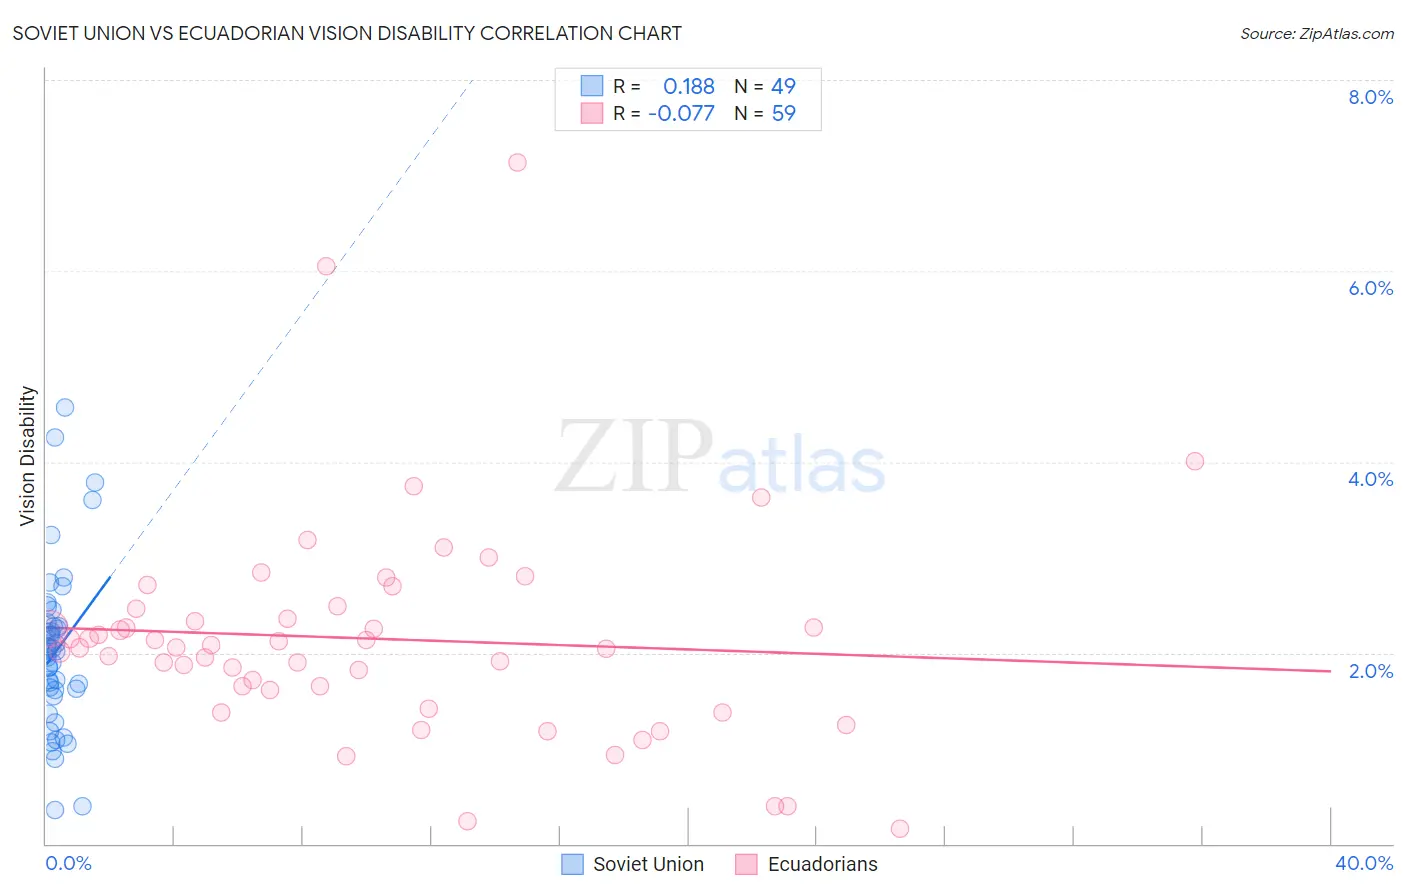
Soviet Union vs Ecuadorian Vision Disability Correlation Chart
The statistical analysis conducted on geographies consisting of 43,504,651 people shows a poor positive correlation between the proportion of Soviet Union and percentage of population with vision disability in the United States with a correlation coefficient (R) of 0.188 and weighted average of 2.0%. Similarly, the statistical analysis conducted on geographies consisting of 317,586,647 people shows a slight negative correlation between the proportion of Ecuadorians and percentage of population with vision disability in the United States with a correlation coefficient (R) of -0.077 and weighted average of 2.3%, a difference of 11.3%.
Vision Disability Correlation Summary
| Measurement | Soviet Union | Ecuadorian |
| Minimum | 0.35% | 0.16% |
| Maximum | 4.6% | 7.1% |
| Range | 4.2% | 7.0% |
| Mean | 2.0% | 2.1% |
| Median | 2.0% | 2.1% |
| Interquartile 25% (IQ1) | 1.6% | 1.6% |
| Interquartile 75% (IQ3) | 2.3% | 2.5% |
| Interquartile Range (IQR) | 0.72% | 0.85% |
| Standard Deviation (Sample) | 0.86% | 1.2% |
| Standard Deviation (Population) | 0.85% | 1.2% |
Similar Demographics by Vision Disability
Demographics Similar to Soviet Union by Vision Disability
In terms of vision disability, the demographic groups most similar to Soviet Union are Immigrants from Poland (2.0%, a difference of 0.020%), Lithuanian (2.0%, a difference of 0.060%), Immigrants from Western Asia (2.0%, a difference of 0.11%), Immigrants from Latvia (2.0%, a difference of 0.22%), and Chinese (2.0%, a difference of 0.28%).
| Demographics | Rating | Rank | Vision Disability |
| Palestinians | 98.3 /100 | #74 | Exceptional 2.0% |
| Immigrants | North Macedonia | 98.3 /100 | #75 | Exceptional 2.0% |
| Paraguayans | 98.3 /100 | #76 | Exceptional 2.0% |
| Immigrants | Jordan | 98.3 /100 | #77 | Exceptional 2.0% |
| Immigrants | Eastern Europe | 98.3 /100 | #78 | Exceptional 2.0% |
| Assyrians/Chaldeans/Syriacs | 98.1 /100 | #79 | Exceptional 2.0% |
| Lithuanians | 97.7 /100 | #80 | Exceptional 2.0% |
| Soviet Union | 97.6 /100 | #81 | Exceptional 2.0% |
| Immigrants | Poland | 97.6 /100 | #82 | Exceptional 2.0% |
| Immigrants | Western Asia | 97.5 /100 | #83 | Exceptional 2.0% |
| Immigrants | Latvia | 97.3 /100 | #84 | Exceptional 2.0% |
| Chinese | 97.2 /100 | #85 | Exceptional 2.0% |
| Immigrants | Moldova | 97.2 /100 | #86 | Exceptional 2.0% |
| Immigrants | Switzerland | 97.0 /100 | #87 | Exceptional 2.0% |
| Norwegians | 97.0 /100 | #88 | Exceptional 2.0% |
Demographics Similar to Ecuadorians by Vision Disability
In terms of vision disability, the demographic groups most similar to Ecuadorians are Portuguese (2.3%, a difference of 0.11%), Barbadian (2.3%, a difference of 0.17%), Guamanian/Chamorro (2.3%, a difference of 0.24%), French Canadian (2.3%, a difference of 0.25%), and Immigrants from Senegal (2.3%, a difference of 0.27%).
| Demographics | Rating | Rank | Vision Disability |
| Bermudans | 9.0 /100 | #212 | Tragic 2.2% |
| Immigrants | Ghana | 8.9 /100 | #213 | Tragic 2.2% |
| Trinidadians and Tobagonians | 8.2 /100 | #214 | Tragic 2.2% |
| Nigerians | 7.2 /100 | #215 | Tragic 2.3% |
| Immigrants | Trinidad and Tobago | 6.1 /100 | #216 | Tragic 2.3% |
| Barbadians | 5.1 /100 | #217 | Tragic 2.3% |
| Portuguese | 4.9 /100 | #218 | Tragic 2.3% |
| Ecuadorians | 4.6 /100 | #219 | Tragic 2.3% |
| Guamanians/Chamorros | 3.9 /100 | #220 | Tragic 2.3% |
| French Canadians | 3.9 /100 | #221 | Tragic 2.3% |
| Immigrants | Senegal | 3.8 /100 | #222 | Tragic 2.3% |
| Basques | 3.5 /100 | #223 | Tragic 2.3% |
| Irish | 3.4 /100 | #224 | Tragic 2.3% |
| Immigrants | Western Africa | 3.4 /100 | #225 | Tragic 2.3% |
| Immigrants | Germany | 3.0 /100 | #226 | Tragic 2.3% |