Immigrants from Burma/Myanmar vs Ecuadorian Unemployment Among Seniors over 65 years
COMPARE
Immigrants from Burma/Myanmar
Ecuadorian
Unemployment Among Seniors over 65 years
Unemployment Among Seniors over 65 years Comparison
Immigrants from Burma/Myanmar
Ecuadorians
4.6%
UNEMPLOYMENT AMONG SENIORS OVER 65 YEARS
100.0/ 100
METRIC RATING
16th/ 347
METRIC RANK
5.6%
UNEMPLOYMENT AMONG SENIORS OVER 65 YEARS
0.0/ 100
METRIC RATING
306th/ 347
METRIC RANK
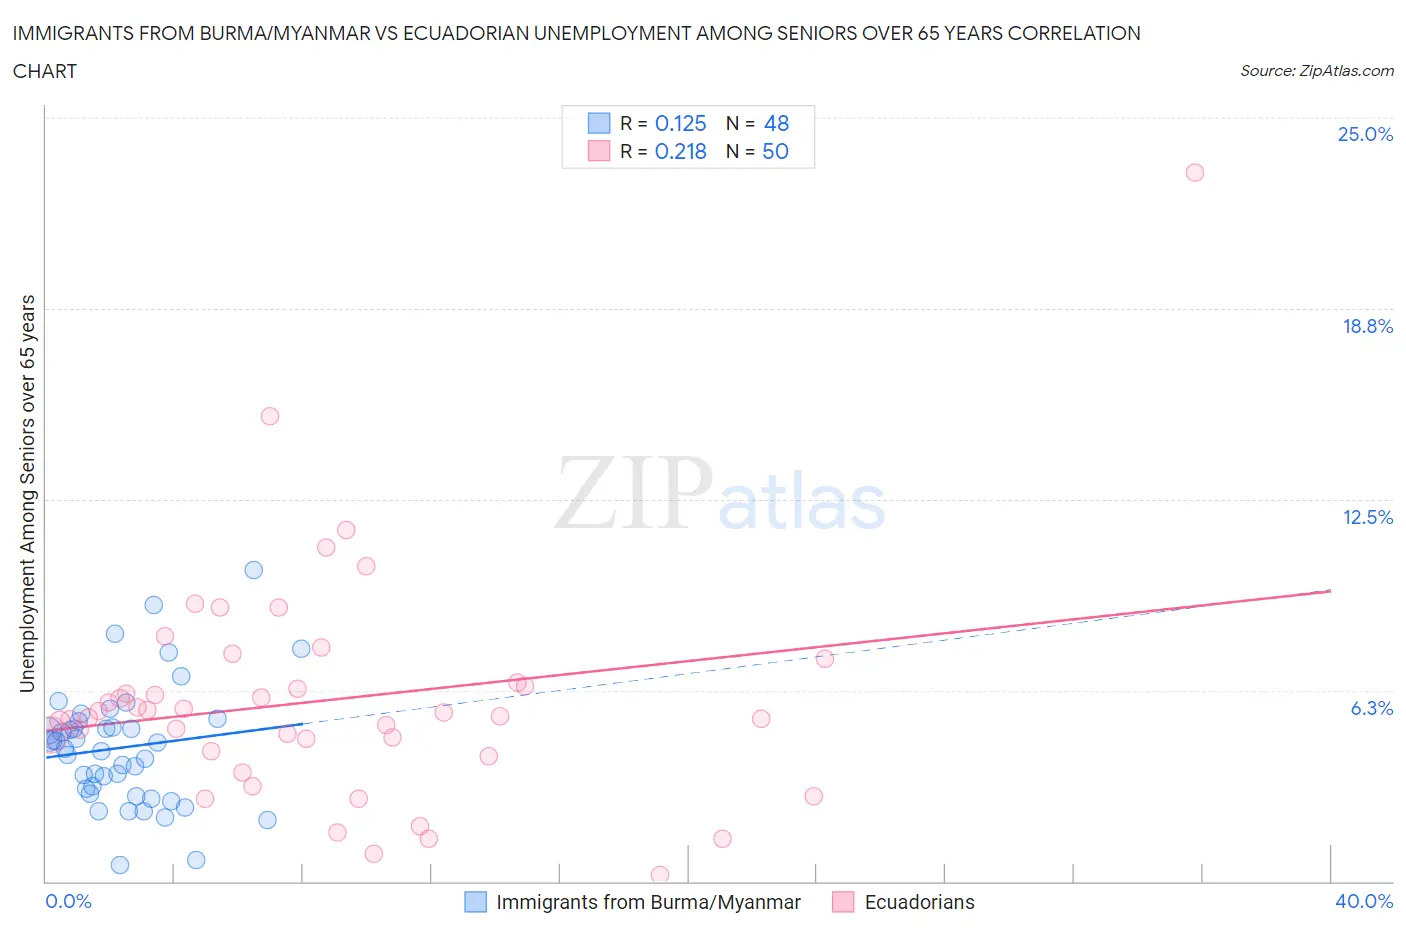
Immigrants from Burma/Myanmar vs Ecuadorian Unemployment Among Seniors over 65 years Correlation Chart
The statistical analysis conducted on geographies consisting of 164,420,398 people shows a poor positive correlation between the proportion of Immigrants from Burma/Myanmar and unemployment rate amomg seniors over the age of 65 in the United States with a correlation coefficient (R) of 0.125 and weighted average of 4.6%. Similarly, the statistical analysis conducted on geographies consisting of 294,826,024 people shows a weak positive correlation between the proportion of Ecuadorians and unemployment rate amomg seniors over the age of 65 in the United States with a correlation coefficient (R) of 0.218 and weighted average of 5.6%, a difference of 20.9%.
Unemployment Among Seniors over 65 years Correlation Summary
| Measurement | Immigrants from Burma/Myanmar | Ecuadorian |
| Minimum | 0.53% | 0.20% |
| Maximum | 10.2% | 23.2% |
| Range | 9.7% | 23.0% |
| Mean | 4.4% | 5.9% |
| Median | 4.4% | 5.5% |
| Interquartile 25% (IQ1) | 3.0% | 4.2% |
| Interquartile 75% (IQ3) | 5.1% | 6.5% |
| Interquartile Range (IQR) | 2.2% | 2.3% |
| Standard Deviation (Sample) | 2.0% | 3.8% |
| Standard Deviation (Population) | 1.9% | 3.7% |
Similar Demographics by Unemployment Among Seniors over 65 years
Demographics Similar to Immigrants from Burma/Myanmar by Unemployment Among Seniors over 65 years
In terms of unemployment among seniors over 65 years, the demographic groups most similar to Immigrants from Burma/Myanmar are Lumbee (4.6%, a difference of 0.010%), Menominee (4.6%, a difference of 0.080%), Creek (4.6%, a difference of 0.11%), Immigrants from Eritrea (4.7%, a difference of 0.40%), and Cuban (4.6%, a difference of 0.52%).
| Demographics | Rating | Rank | Unemployment Among Seniors over 65 years |
| Indonesians | 100.0 /100 | #9 | Exceptional 4.5% |
| Immigrants | Zaire | 100.0 /100 | #10 | Exceptional 4.5% |
| Comanche | 100.0 /100 | #11 | Exceptional 4.6% |
| Osage | 100.0 /100 | #12 | Exceptional 4.6% |
| Cubans | 100.0 /100 | #13 | Exceptional 4.6% |
| Menominee | 100.0 /100 | #14 | Exceptional 4.6% |
| Lumbee | 100.0 /100 | #15 | Exceptional 4.6% |
| Immigrants | Burma/Myanmar | 100.0 /100 | #16 | Exceptional 4.6% |
| Creek | 100.0 /100 | #17 | Exceptional 4.6% |
| Immigrants | Eritrea | 100.0 /100 | #18 | Exceptional 4.7% |
| Lebanese | 100.0 /100 | #19 | Exceptional 4.7% |
| Immigrants | Nepal | 100.0 /100 | #20 | Exceptional 4.7% |
| Norwegians | 100.0 /100 | #21 | Exceptional 4.7% |
| Czechs | 100.0 /100 | #22 | Exceptional 4.7% |
| Kenyans | 100.0 /100 | #23 | Exceptional 4.7% |
Demographics Similar to Ecuadorians by Unemployment Among Seniors over 65 years
In terms of unemployment among seniors over 65 years, the demographic groups most similar to Ecuadorians are Mexican (5.6%, a difference of 0.040%), Portuguese (5.6%, a difference of 0.050%), Immigrants from St. Vincent and the Grenadines (5.6%, a difference of 0.14%), Liberian (5.6%, a difference of 0.21%), and Immigrants from Latin America (5.6%, a difference of 0.28%).
| Demographics | Rating | Rank | Unemployment Among Seniors over 65 years |
| Guyanese | 0.0 /100 | #299 | Tragic 5.6% |
| Zimbabweans | 0.0 /100 | #300 | Tragic 5.6% |
| Hispanics or Latinos | 0.0 /100 | #301 | Tragic 5.6% |
| Guatemalans | 0.0 /100 | #302 | Tragic 5.6% |
| Immigrants | Latin America | 0.0 /100 | #303 | Tragic 5.6% |
| Liberians | 0.0 /100 | #304 | Tragic 5.6% |
| Mexicans | 0.0 /100 | #305 | Tragic 5.6% |
| Ecuadorians | 0.0 /100 | #306 | Tragic 5.6% |
| Portuguese | 0.0 /100 | #307 | Tragic 5.6% |
| Immigrants | St. Vincent and the Grenadines | 0.0 /100 | #308 | Tragic 5.6% |
| Immigrants | Guatemala | 0.0 /100 | #309 | Tragic 5.6% |
| Salvadorans | 0.0 /100 | #310 | Tragic 5.6% |
| Immigrants | Guyana | 0.0 /100 | #311 | Tragic 5.6% |
| Immigrants | Ecuador | 0.0 /100 | #312 | Tragic 5.6% |
| Barbadians | 0.0 /100 | #313 | Tragic 5.6% |