Immigrants from El Salvador vs Ecuadorian Vision Disability
COMPARE
Immigrants from El Salvador
Ecuadorian
Vision Disability
Vision Disability Comparison
Immigrants from El Salvador
Ecuadorians
2.2%
VISION DISABILITY
21.0/ 100
METRIC RATING
199th/ 347
METRIC RANK
2.3%
VISION DISABILITY
4.6/ 100
METRIC RATING
219th/ 347
METRIC RANK
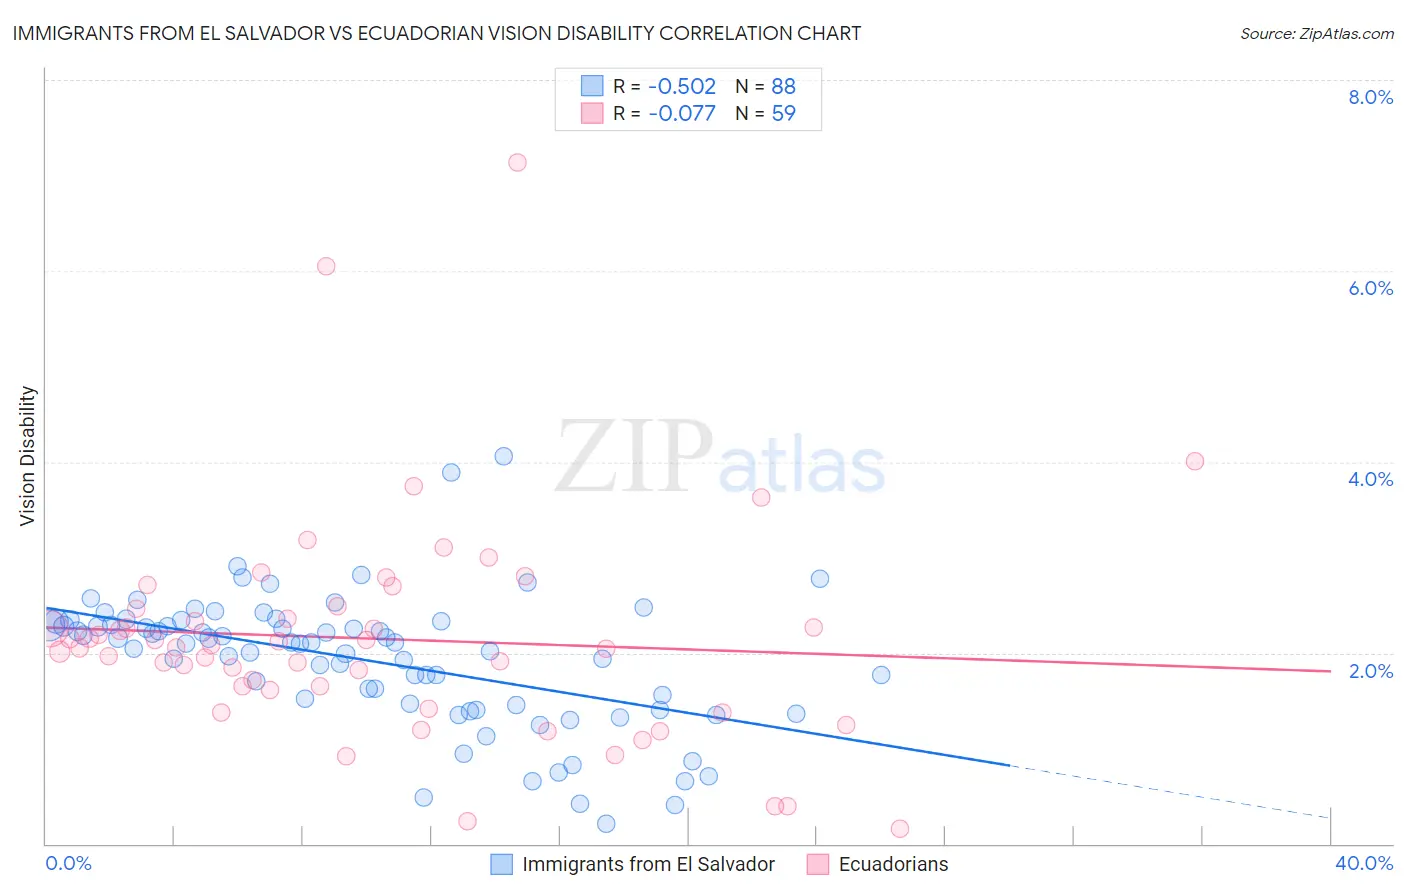
Immigrants from El Salvador vs Ecuadorian Vision Disability Correlation Chart
The statistical analysis conducted on geographies consisting of 357,605,888 people shows a substantial negative correlation between the proportion of Immigrants from El Salvador and percentage of population with vision disability in the United States with a correlation coefficient (R) of -0.502 and weighted average of 2.2%. Similarly, the statistical analysis conducted on geographies consisting of 317,586,647 people shows a slight negative correlation between the proportion of Ecuadorians and percentage of population with vision disability in the United States with a correlation coefficient (R) of -0.077 and weighted average of 2.3%, a difference of 2.6%.
Vision Disability Correlation Summary
| Measurement | Immigrants from El Salvador | Ecuadorian |
| Minimum | 0.21% | 0.16% |
| Maximum | 4.1% | 7.1% |
| Range | 3.9% | 7.0% |
| Mean | 1.9% | 2.1% |
| Median | 2.1% | 2.1% |
| Interquartile 25% (IQ1) | 1.5% | 1.6% |
| Interquartile 75% (IQ3) | 2.3% | 2.5% |
| Interquartile Range (IQR) | 0.86% | 0.85% |
| Standard Deviation (Sample) | 0.70% | 1.2% |
| Standard Deviation (Population) | 0.69% | 1.2% |
Demographics Similar to Immigrants from El Salvador and Ecuadorians by Vision Disability
In terms of vision disability, the demographic groups most similar to Immigrants from El Salvador are Immigrants from Thailand (2.2%, a difference of 0.090%), Slovak (2.2%, a difference of 0.21%), Immigrants from Zaire (2.2%, a difference of 0.30%), Dutch (2.2%, a difference of 0.40%), and Immigrants from Guyana (2.2%, a difference of 0.53%). Similarly, the demographic groups most similar to Ecuadorians are Portuguese (2.3%, a difference of 0.11%), Barbadian (2.3%, a difference of 0.17%), Immigrants from Trinidad and Tobago (2.3%, a difference of 0.45%), Nigerian (2.3%, a difference of 0.74%), and Trinidadian and Tobagonian (2.2%, a difference of 0.95%).
| Demographics | Rating | Rank | Vision Disability |
| Immigrants | El Salvador | 21.0 /100 | #199 | Fair 2.2% |
| Immigrants | Thailand | 20.1 /100 | #200 | Fair 2.2% |
| Slovaks | 18.8 /100 | #201 | Poor 2.2% |
| Immigrants | Zaire | 18.0 /100 | #202 | Poor 2.2% |
| Dutch | 17.1 /100 | #203 | Poor 2.2% |
| Immigrants | Guyana | 15.9 /100 | #204 | Poor 2.2% |
| Samoans | 15.7 /100 | #205 | Poor 2.2% |
| Pennsylvania Germans | 14.5 /100 | #206 | Poor 2.2% |
| Immigrants | Nigeria | 13.5 /100 | #207 | Poor 2.2% |
| Germans | 13.4 /100 | #208 | Poor 2.2% |
| Immigrants | Brazil | 13.1 /100 | #209 | Poor 2.2% |
| Immigrants | Uruguay | 11.5 /100 | #210 | Poor 2.2% |
| Indonesians | 9.5 /100 | #211 | Tragic 2.2% |
| Bermudans | 9.0 /100 | #212 | Tragic 2.2% |
| Immigrants | Ghana | 8.9 /100 | #213 | Tragic 2.2% |
| Trinidadians and Tobagonians | 8.2 /100 | #214 | Tragic 2.2% |
| Nigerians | 7.2 /100 | #215 | Tragic 2.3% |
| Immigrants | Trinidad and Tobago | 6.1 /100 | #216 | Tragic 2.3% |
| Barbadians | 5.1 /100 | #217 | Tragic 2.3% |
| Portuguese | 4.9 /100 | #218 | Tragic 2.3% |
| Ecuadorians | 4.6 /100 | #219 | Tragic 2.3% |