Costa Rican vs Ecuadorian Vision Disability
COMPARE
Costa Rican
Ecuadorian
Vision Disability
Vision Disability Comparison
Costa Ricans
Ecuadorians
2.2%
VISION DISABILITY
40.7/ 100
METRIC RATING
182nd/ 347
METRIC RANK
2.3%
VISION DISABILITY
4.6/ 100
METRIC RATING
219th/ 347
METRIC RANK
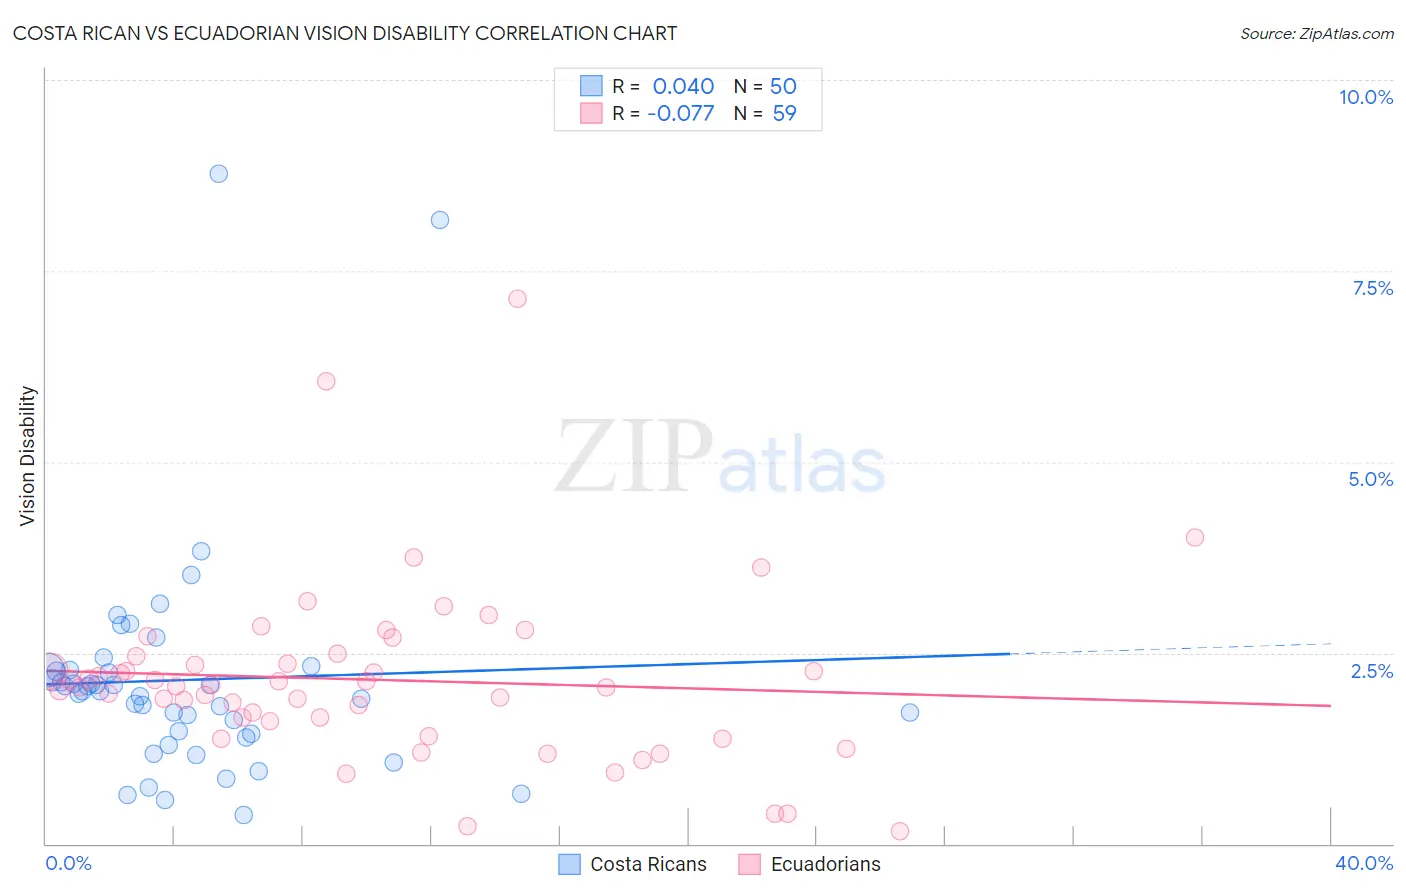
Costa Rican vs Ecuadorian Vision Disability Correlation Chart
The statistical analysis conducted on geographies consisting of 253,497,093 people shows no correlation between the proportion of Costa Ricans and percentage of population with vision disability in the United States with a correlation coefficient (R) of 0.040 and weighted average of 2.2%. Similarly, the statistical analysis conducted on geographies consisting of 317,586,647 people shows a slight negative correlation between the proportion of Ecuadorians and percentage of population with vision disability in the United States with a correlation coefficient (R) of -0.077 and weighted average of 2.3%, a difference of 4.2%.
Vision Disability Correlation Summary
| Measurement | Costa Rican | Ecuadorian |
| Minimum | 0.38% | 0.16% |
| Maximum | 8.8% | 7.1% |
| Range | 8.4% | 7.0% |
| Mean | 2.1% | 2.1% |
| Median | 2.0% | 2.1% |
| Interquartile 25% (IQ1) | 1.4% | 1.6% |
| Interquartile 75% (IQ3) | 2.3% | 2.5% |
| Interquartile Range (IQR) | 0.84% | 0.85% |
| Standard Deviation (Sample) | 1.5% | 1.2% |
| Standard Deviation (Population) | 1.5% | 1.2% |
Similar Demographics by Vision Disability
Demographics Similar to Costa Ricans by Vision Disability
In terms of vision disability, the demographic groups most similar to Costa Ricans are Immigrants from Western Europe (2.2%, a difference of 0.020%), Uruguayan (2.2%, a difference of 0.13%), Immigrants from Burma/Myanmar (2.2%, a difference of 0.19%), Immigrants from North America (2.2%, a difference of 0.24%), and Immigrants from Oceania (2.2%, a difference of 0.28%).
| Demographics | Rating | Rank | Vision Disability |
| Immigrants | Fiji | 47.6 /100 | #175 | Average 2.2% |
| Yugoslavians | 46.5 /100 | #176 | Average 2.2% |
| Slavs | 46.0 /100 | #177 | Average 2.2% |
| Immigrants | Oceania | 45.1 /100 | #178 | Average 2.2% |
| Immigrants | North America | 44.5 /100 | #179 | Average 2.2% |
| Uruguayans | 42.7 /100 | #180 | Average 2.2% |
| Immigrants | Western Europe | 41.1 /100 | #181 | Average 2.2% |
| Costa Ricans | 40.7 /100 | #182 | Average 2.2% |
| Immigrants | Burma/Myanmar | 37.9 /100 | #183 | Fair 2.2% |
| Moroccans | 35.4 /100 | #184 | Fair 2.2% |
| Immigrants | Middle Africa | 33.5 /100 | #185 | Fair 2.2% |
| Native Hawaiians | 33.3 /100 | #186 | Fair 2.2% |
| Immigrants | St. Vincent and the Grenadines | 30.3 /100 | #187 | Fair 2.2% |
| Guyanese | 28.9 /100 | #188 | Fair 2.2% |
| Salvadorans | 27.4 /100 | #189 | Fair 2.2% |
Demographics Similar to Ecuadorians by Vision Disability
In terms of vision disability, the demographic groups most similar to Ecuadorians are Portuguese (2.3%, a difference of 0.11%), Barbadian (2.3%, a difference of 0.17%), Guamanian/Chamorro (2.3%, a difference of 0.24%), French Canadian (2.3%, a difference of 0.25%), and Immigrants from Senegal (2.3%, a difference of 0.27%).
| Demographics | Rating | Rank | Vision Disability |
| Bermudans | 9.0 /100 | #212 | Tragic 2.2% |
| Immigrants | Ghana | 8.9 /100 | #213 | Tragic 2.2% |
| Trinidadians and Tobagonians | 8.2 /100 | #214 | Tragic 2.2% |
| Nigerians | 7.2 /100 | #215 | Tragic 2.3% |
| Immigrants | Trinidad and Tobago | 6.1 /100 | #216 | Tragic 2.3% |
| Barbadians | 5.1 /100 | #217 | Tragic 2.3% |
| Portuguese | 4.9 /100 | #218 | Tragic 2.3% |
| Ecuadorians | 4.6 /100 | #219 | Tragic 2.3% |
| Guamanians/Chamorros | 3.9 /100 | #220 | Tragic 2.3% |
| French Canadians | 3.9 /100 | #221 | Tragic 2.3% |
| Immigrants | Senegal | 3.8 /100 | #222 | Tragic 2.3% |
| Basques | 3.5 /100 | #223 | Tragic 2.3% |
| Irish | 3.4 /100 | #224 | Tragic 2.3% |
| Immigrants | Western Africa | 3.4 /100 | #225 | Tragic 2.3% |
| Immigrants | Germany | 3.0 /100 | #226 | Tragic 2.3% |