Cape Verdean vs Ecuadorian Vision Disability
COMPARE
Cape Verdean
Ecuadorian
Vision Disability
Vision Disability Comparison
Cape Verdeans
Ecuadorians
2.4%
VISION DISABILITY
0.0/ 100
METRIC RATING
280th/ 347
METRIC RANK
2.3%
VISION DISABILITY
4.6/ 100
METRIC RATING
219th/ 347
METRIC RANK
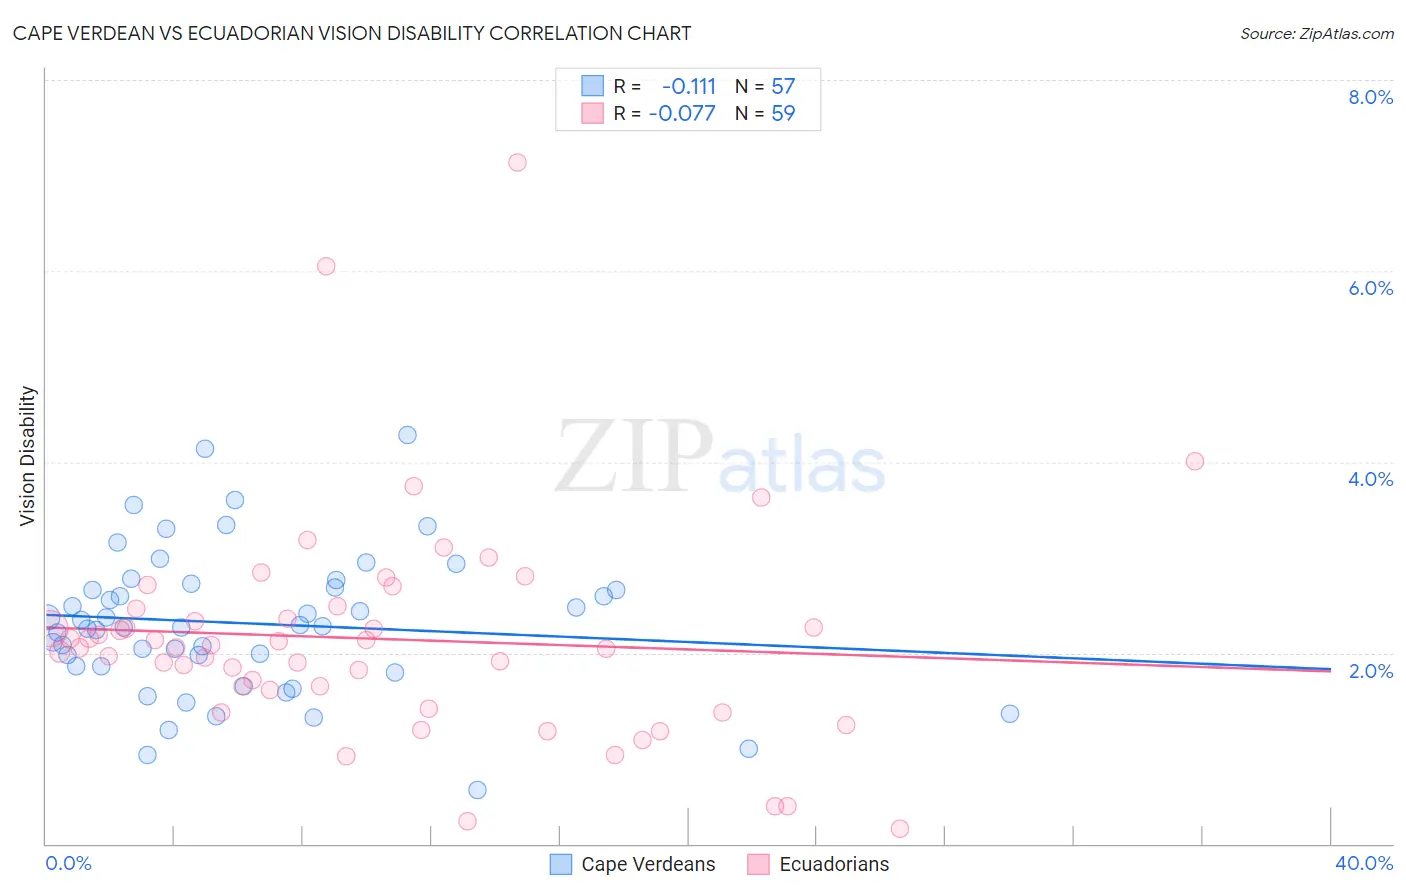
Cape Verdean vs Ecuadorian Vision Disability Correlation Chart
The statistical analysis conducted on geographies consisting of 107,539,896 people shows a poor negative correlation between the proportion of Cape Verdeans and percentage of population with vision disability in the United States with a correlation coefficient (R) of -0.111 and weighted average of 2.4%. Similarly, the statistical analysis conducted on geographies consisting of 317,586,647 people shows a slight negative correlation between the proportion of Ecuadorians and percentage of population with vision disability in the United States with a correlation coefficient (R) of -0.077 and weighted average of 2.3%, a difference of 7.8%.
Vision Disability Correlation Summary
| Measurement | Cape Verdean | Ecuadorian |
| Minimum | 0.56% | 0.16% |
| Maximum | 4.3% | 7.1% |
| Range | 3.7% | 7.0% |
| Mean | 2.3% | 2.1% |
| Median | 2.3% | 2.1% |
| Interquartile 25% (IQ1) | 1.9% | 1.6% |
| Interquartile 75% (IQ3) | 2.7% | 2.5% |
| Interquartile Range (IQR) | 0.84% | 0.85% |
| Standard Deviation (Sample) | 0.75% | 1.2% |
| Standard Deviation (Population) | 0.74% | 1.2% |
Similar Demographics by Vision Disability
Demographics Similar to Cape Verdeans by Vision Disability
In terms of vision disability, the demographic groups most similar to Cape Verdeans are Nepalese (2.4%, a difference of 0.040%), Spanish (2.4%, a difference of 0.050%), Bahamian (2.4%, a difference of 0.21%), U.S. Virgin Islander (2.5%, a difference of 0.23%), and Scotch-Irish (2.4%, a difference of 0.25%).
| Demographics | Rating | Rank | Vision Disability |
| Immigrants | Bahamas | 0.1 /100 | #273 | Tragic 2.4% |
| Immigrants | Latin America | 0.0 /100 | #274 | Tragic 2.4% |
| Chippewa | 0.0 /100 | #275 | Tragic 2.4% |
| Scotch-Irish | 0.0 /100 | #276 | Tragic 2.4% |
| Bahamians | 0.0 /100 | #277 | Tragic 2.4% |
| Spanish | 0.0 /100 | #278 | Tragic 2.4% |
| Nepalese | 0.0 /100 | #279 | Tragic 2.4% |
| Cape Verdeans | 0.0 /100 | #280 | Tragic 2.4% |
| U.S. Virgin Islanders | 0.0 /100 | #281 | Tragic 2.5% |
| Immigrants | Caribbean | 0.0 /100 | #282 | Tragic 2.5% |
| Puget Sound Salish | 0.0 /100 | #283 | Tragic 2.5% |
| Yakama | 0.0 /100 | #284 | Tragic 2.5% |
| Immigrants | Central America | 0.0 /100 | #285 | Tragic 2.5% |
| Sioux | 0.0 /100 | #286 | Tragic 2.5% |
| Hondurans | 0.0 /100 | #287 | Tragic 2.5% |
Demographics Similar to Ecuadorians by Vision Disability
In terms of vision disability, the demographic groups most similar to Ecuadorians are Portuguese (2.3%, a difference of 0.11%), Barbadian (2.3%, a difference of 0.17%), Guamanian/Chamorro (2.3%, a difference of 0.24%), French Canadian (2.3%, a difference of 0.25%), and Immigrants from Senegal (2.3%, a difference of 0.27%).
| Demographics | Rating | Rank | Vision Disability |
| Bermudans | 9.0 /100 | #212 | Tragic 2.2% |
| Immigrants | Ghana | 8.9 /100 | #213 | Tragic 2.2% |
| Trinidadians and Tobagonians | 8.2 /100 | #214 | Tragic 2.2% |
| Nigerians | 7.2 /100 | #215 | Tragic 2.3% |
| Immigrants | Trinidad and Tobago | 6.1 /100 | #216 | Tragic 2.3% |
| Barbadians | 5.1 /100 | #217 | Tragic 2.3% |
| Portuguese | 4.9 /100 | #218 | Tragic 2.3% |
| Ecuadorians | 4.6 /100 | #219 | Tragic 2.3% |
| Guamanians/Chamorros | 3.9 /100 | #220 | Tragic 2.3% |
| French Canadians | 3.9 /100 | #221 | Tragic 2.3% |
| Immigrants | Senegal | 3.8 /100 | #222 | Tragic 2.3% |
| Basques | 3.5 /100 | #223 | Tragic 2.3% |
| Irish | 3.4 /100 | #224 | Tragic 2.3% |
| Immigrants | Western Africa | 3.4 /100 | #225 | Tragic 2.3% |
| Immigrants | Germany | 3.0 /100 | #226 | Tragic 2.3% |