Immigrants from Lithuania vs Ecuadorian Vision Disability
COMPARE
Immigrants from Lithuania
Ecuadorian
Vision Disability
Vision Disability Comparison
Immigrants from Lithuania
Ecuadorians
1.9%
VISION DISABILITY
99.9/ 100
METRIC RATING
24th/ 347
METRIC RANK
2.3%
VISION DISABILITY
4.6/ 100
METRIC RATING
219th/ 347
METRIC RANK
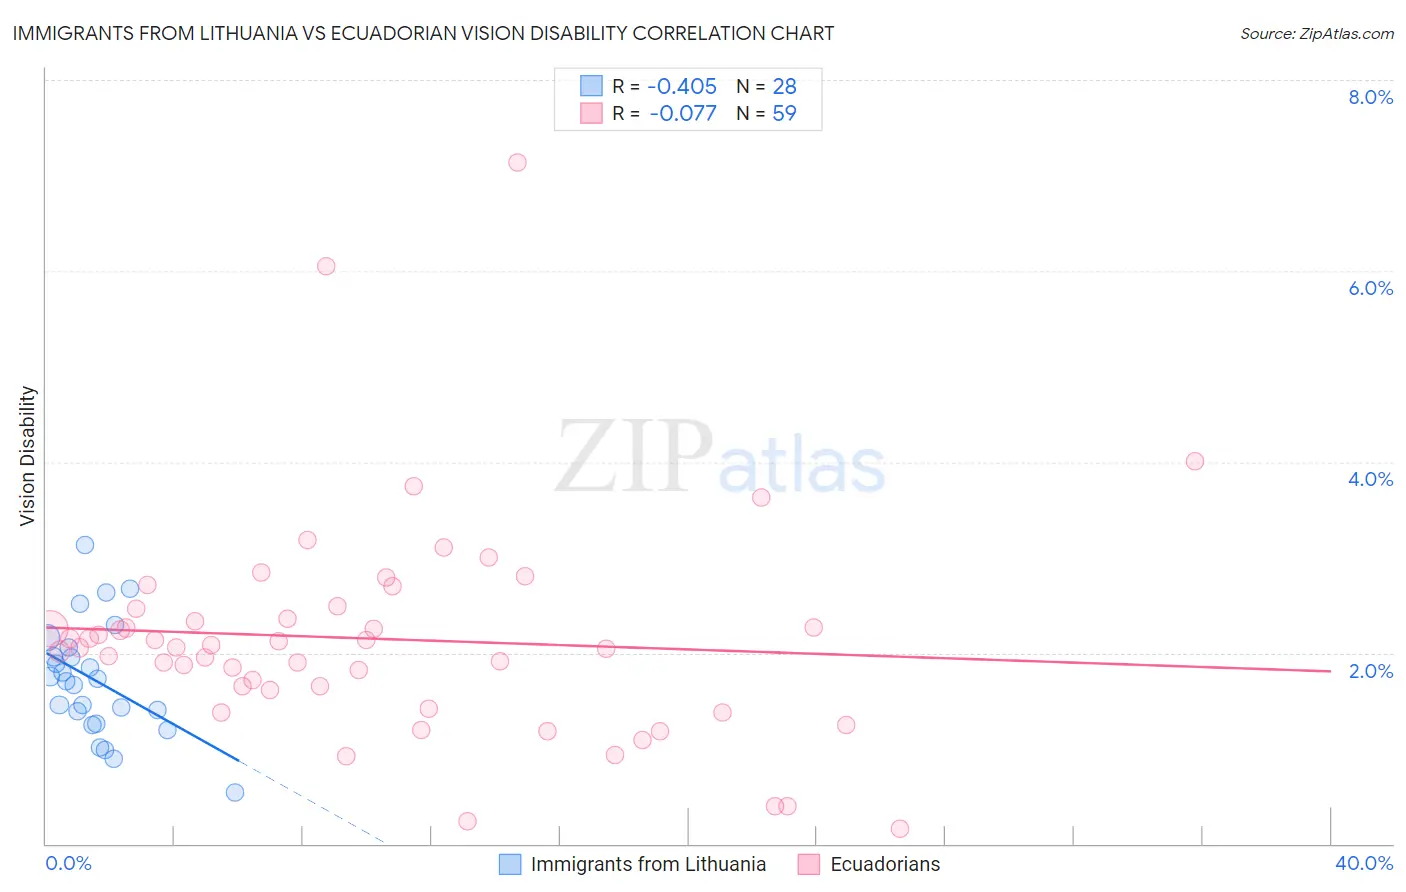
Immigrants from Lithuania vs Ecuadorian Vision Disability Correlation Chart
The statistical analysis conducted on geographies consisting of 117,709,578 people shows a moderate negative correlation between the proportion of Immigrants from Lithuania and percentage of population with vision disability in the United States with a correlation coefficient (R) of -0.405 and weighted average of 1.9%. Similarly, the statistical analysis conducted on geographies consisting of 317,586,647 people shows a slight negative correlation between the proportion of Ecuadorians and percentage of population with vision disability in the United States with a correlation coefficient (R) of -0.077 and weighted average of 2.3%, a difference of 18.2%.
Vision Disability Correlation Summary
| Measurement | Immigrants from Lithuania | Ecuadorian |
| Minimum | 0.53% | 0.16% |
| Maximum | 3.1% | 7.1% |
| Range | 2.6% | 7.0% |
| Mean | 1.7% | 2.1% |
| Median | 1.7% | 2.1% |
| Interquartile 25% (IQ1) | 1.3% | 1.6% |
| Interquartile 75% (IQ3) | 2.0% | 2.5% |
| Interquartile Range (IQR) | 0.69% | 0.85% |
| Standard Deviation (Sample) | 0.59% | 1.2% |
| Standard Deviation (Population) | 0.58% | 1.2% |
Similar Demographics by Vision Disability
Demographics Similar to Immigrants from Lithuania by Vision Disability
In terms of vision disability, the demographic groups most similar to Immigrants from Lithuania are Bulgarian (1.9%, a difference of 0.040%), Immigrants from Japan (1.9%, a difference of 0.080%), Immigrants from Asia (1.9%, a difference of 0.12%), Taiwanese (1.9%, a difference of 0.41%), and Immigrants from Malaysia (1.9%, a difference of 0.44%).
| Demographics | Rating | Rank | Vision Disability |
| Burmese | 100.0 /100 | #17 | Exceptional 1.8% |
| Bolivians | 100.0 /100 | #18 | Exceptional 1.9% |
| Immigrants | Sri Lanka | 100.0 /100 | #19 | Exceptional 1.9% |
| Asians | 100.0 /100 | #20 | Exceptional 1.9% |
| Turks | 100.0 /100 | #21 | Exceptional 1.9% |
| Immigrants | Pakistan | 100.0 /100 | #22 | Exceptional 1.9% |
| Immigrants | Asia | 99.9 /100 | #23 | Exceptional 1.9% |
| Immigrants | Lithuania | 99.9 /100 | #24 | Exceptional 1.9% |
| Bulgarians | 99.9 /100 | #25 | Exceptional 1.9% |
| Immigrants | Japan | 99.9 /100 | #26 | Exceptional 1.9% |
| Taiwanese | 99.9 /100 | #27 | Exceptional 1.9% |
| Immigrants | Malaysia | 99.9 /100 | #28 | Exceptional 1.9% |
| Egyptians | 99.9 /100 | #29 | Exceptional 1.9% |
| Immigrants | Nepal | 99.9 /100 | #30 | Exceptional 1.9% |
| Mongolians | 99.9 /100 | #31 | Exceptional 1.9% |
Demographics Similar to Ecuadorians by Vision Disability
In terms of vision disability, the demographic groups most similar to Ecuadorians are Portuguese (2.3%, a difference of 0.11%), Barbadian (2.3%, a difference of 0.17%), Guamanian/Chamorro (2.3%, a difference of 0.24%), French Canadian (2.3%, a difference of 0.25%), and Immigrants from Senegal (2.3%, a difference of 0.27%).
| Demographics | Rating | Rank | Vision Disability |
| Bermudans | 9.0 /100 | #212 | Tragic 2.2% |
| Immigrants | Ghana | 8.9 /100 | #213 | Tragic 2.2% |
| Trinidadians and Tobagonians | 8.2 /100 | #214 | Tragic 2.2% |
| Nigerians | 7.2 /100 | #215 | Tragic 2.3% |
| Immigrants | Trinidad and Tobago | 6.1 /100 | #216 | Tragic 2.3% |
| Barbadians | 5.1 /100 | #217 | Tragic 2.3% |
| Portuguese | 4.9 /100 | #218 | Tragic 2.3% |
| Ecuadorians | 4.6 /100 | #219 | Tragic 2.3% |
| Guamanians/Chamorros | 3.9 /100 | #220 | Tragic 2.3% |
| French Canadians | 3.9 /100 | #221 | Tragic 2.3% |
| Immigrants | Senegal | 3.8 /100 | #222 | Tragic 2.3% |
| Basques | 3.5 /100 | #223 | Tragic 2.3% |
| Irish | 3.4 /100 | #224 | Tragic 2.3% |
| Immigrants | Western Africa | 3.4 /100 | #225 | Tragic 2.3% |
| Immigrants | Germany | 3.0 /100 | #226 | Tragic 2.3% |