Immigrants from Honduras vs Delaware Disability Age 65 to 74
COMPARE
Immigrants from Honduras
Delaware
Disability Age 65 to 74
Disability Age 65 to 74 Comparison
Immigrants from Honduras
Delaware
25.9%
DISABILITY AGE 65 TO 74
0.1/ 100
METRIC RATING
281st/ 347
METRIC RANK
25.9%
DISABILITY AGE 65 TO 74
0.1/ 100
METRIC RATING
282nd/ 347
METRIC RANK
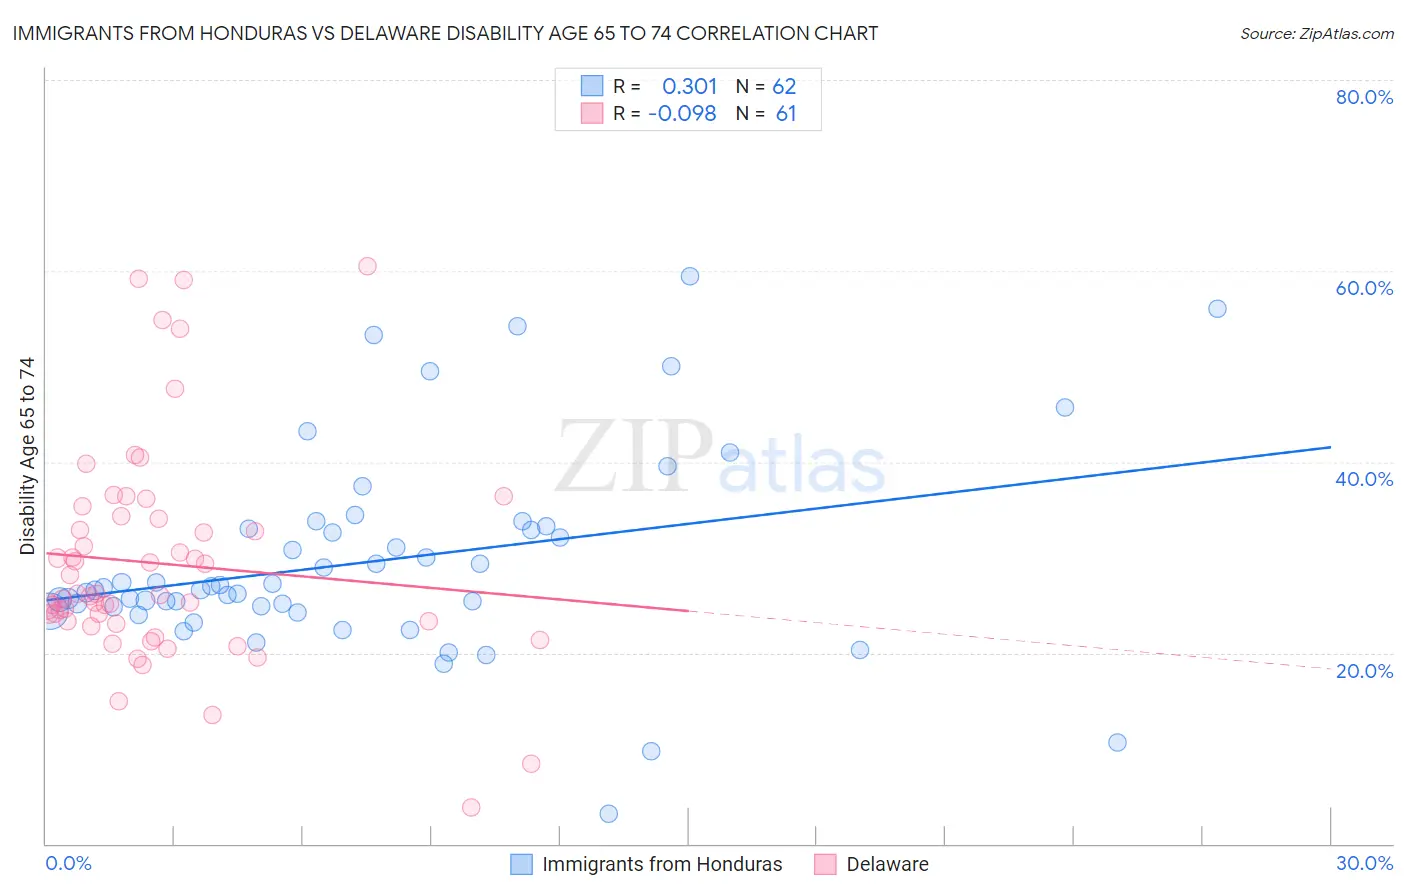
Immigrants from Honduras vs Delaware Disability Age 65 to 74 Correlation Chart
The statistical analysis conducted on geographies consisting of 322,261,679 people shows a mild positive correlation between the proportion of Immigrants from Honduras and percentage of population with a disability between the ages 65 and 75 in the United States with a correlation coefficient (R) of 0.301 and weighted average of 25.9%. Similarly, the statistical analysis conducted on geographies consisting of 96,201,129 people shows a slight negative correlation between the proportion of Delaware and percentage of population with a disability between the ages 65 and 75 in the United States with a correlation coefficient (R) of -0.098 and weighted average of 25.9%, a difference of 0.070%.
Disability Age 65 to 74 Correlation Summary
| Measurement | Immigrants from Honduras | Delaware |
| Minimum | 3.1% | 3.8% |
| Maximum | 59.5% | 60.5% |
| Range | 56.4% | 56.6% |
| Mean | 29.6% | 29.3% |
| Median | 26.7% | 26.1% |
| Interquartile 25% (IQ1) | 24.8% | 23.2% |
| Interquartile 75% (IQ3) | 33.0% | 34.2% |
| Interquartile Range (IQR) | 8.2% | 11.0% |
| Standard Deviation (Sample) | 10.6% | 11.4% |
| Standard Deviation (Population) | 10.6% | 11.3% |
Demographics Similar to Immigrants from Honduras and Delaware by Disability Age 65 to 74
In terms of disability age 65 to 74, the demographic groups most similar to Immigrants from Honduras are Cree (25.9%, a difference of 0.020%), U.S. Virgin Islander (25.9%, a difference of 0.10%), Immigrants from Belize (25.8%, a difference of 0.19%), Belizean (25.8%, a difference of 0.21%), and Spanish American (25.9%, a difference of 0.21%). Similarly, the demographic groups most similar to Delaware are Cree (25.9%, a difference of 0.090%), Spanish American (25.9%, a difference of 0.14%), U.S. Virgin Islander (25.9%, a difference of 0.18%), Immigrants from Belize (25.8%, a difference of 0.26%), and Belizean (25.8%, a difference of 0.28%).
| Demographics | Rating | Rank | Disability Age 65 to 74 |
| Immigrants | Liberia | 0.1 /100 | #271 | Tragic 25.7% |
| Immigrants | Dominica | 0.1 /100 | #272 | Tragic 25.7% |
| Japanese | 0.1 /100 | #273 | Tragic 25.7% |
| Americans | 0.1 /100 | #274 | Tragic 25.8% |
| Hondurans | 0.1 /100 | #275 | Tragic 25.8% |
| French American Indians | 0.1 /100 | #276 | Tragic 25.8% |
| Belizeans | 0.1 /100 | #277 | Tragic 25.8% |
| Immigrants | Belize | 0.1 /100 | #278 | Tragic 25.8% |
| U.S. Virgin Islanders | 0.1 /100 | #279 | Tragic 25.9% |
| Cree | 0.1 /100 | #280 | Tragic 25.9% |
| Immigrants | Honduras | 0.1 /100 | #281 | Tragic 25.9% |
| Delaware | 0.1 /100 | #282 | Tragic 25.9% |
| Spanish Americans | 0.0 /100 | #283 | Tragic 25.9% |
| Immigrants | Azores | 0.0 /100 | #284 | Tragic 26.0% |
| Immigrants | Congo | 0.0 /100 | #285 | Tragic 26.0% |
| Immigrants | Micronesia | 0.0 /100 | #286 | Tragic 26.1% |
| Immigrants | Laos | 0.0 /100 | #287 | Tragic 26.1% |
| Mexican American Indians | 0.0 /100 | #288 | Tragic 26.2% |
| Africans | 0.0 /100 | #289 | Tragic 26.2% |
| Immigrants | Cabo Verde | 0.0 /100 | #290 | Tragic 26.3% |
| Spanish American Indians | 0.0 /100 | #291 | Tragic 26.4% |