Hawaiian vs Delaware Disability Age 65 to 74
COMPARE
Hawaiian
Delaware
Disability Age 65 to 74
Disability Age 65 to 74 Comparison
Hawaiians
Delaware
25.5%
DISABILITY AGE 65 TO 74
0.2/ 100
METRIC RATING
264th/ 347
METRIC RANK
25.9%
DISABILITY AGE 65 TO 74
0.1/ 100
METRIC RATING
282nd/ 347
METRIC RANK
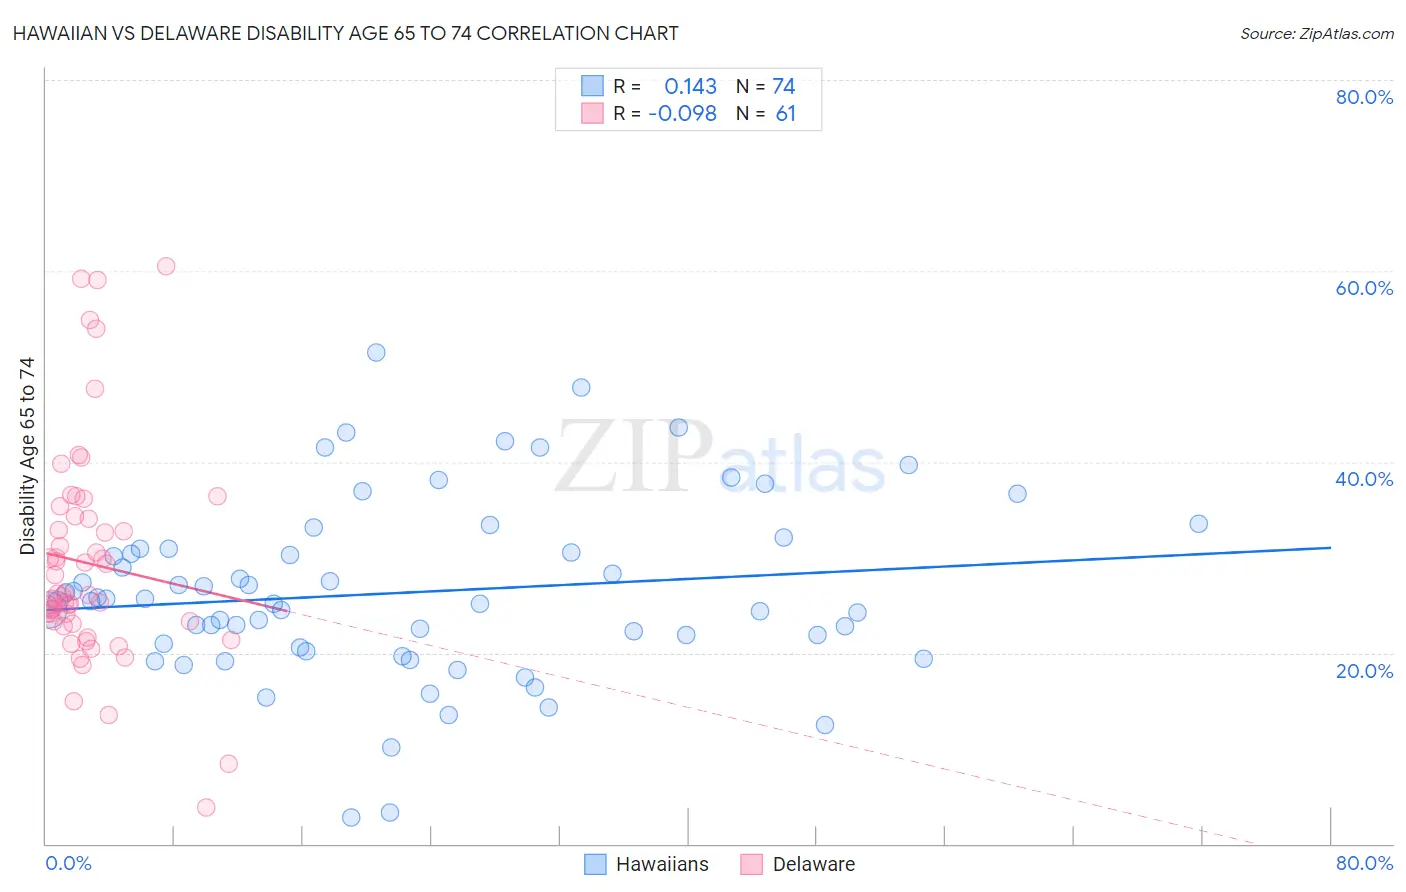
Hawaiian vs Delaware Disability Age 65 to 74 Correlation Chart
The statistical analysis conducted on geographies consisting of 326,781,274 people shows a poor positive correlation between the proportion of Hawaiians and percentage of population with a disability between the ages 65 and 75 in the United States with a correlation coefficient (R) of 0.143 and weighted average of 25.5%. Similarly, the statistical analysis conducted on geographies consisting of 96,201,129 people shows a slight negative correlation between the proportion of Delaware and percentage of population with a disability between the ages 65 and 75 in the United States with a correlation coefficient (R) of -0.098 and weighted average of 25.9%, a difference of 1.5%.
Disability Age 65 to 74 Correlation Summary
| Measurement | Hawaiian | Delaware |
| Minimum | 2.7% | 3.8% |
| Maximum | 51.5% | 60.5% |
| Range | 48.8% | 56.6% |
| Mean | 26.3% | 29.3% |
| Median | 25.4% | 26.1% |
| Interquartile 25% (IQ1) | 20.5% | 23.2% |
| Interquartile 75% (IQ3) | 30.8% | 34.2% |
| Interquartile Range (IQR) | 10.3% | 11.0% |
| Standard Deviation (Sample) | 9.4% | 11.4% |
| Standard Deviation (Population) | 9.3% | 11.3% |
Demographics Similar to Hawaiians and Delaware by Disability Age 65 to 74
In terms of disability age 65 to 74, the demographic groups most similar to Hawaiians are Guatemalan (25.5%, a difference of 0.050%), Immigrants from Latin America (25.6%, a difference of 0.13%), Ottawa (25.6%, a difference of 0.27%), Iroquois (25.4%, a difference of 0.34%), and Liberian (25.6%, a difference of 0.37%). Similarly, the demographic groups most similar to Delaware are Immigrants from Honduras (25.9%, a difference of 0.070%), Cree (25.9%, a difference of 0.090%), Spanish American (25.9%, a difference of 0.14%), U.S. Virgin Islander (25.9%, a difference of 0.18%), and Immigrants from Belize (25.8%, a difference of 0.26%).
| Demographics | Rating | Rank | Disability Age 65 to 74 |
| Iroquois | 0.2 /100 | #263 | Tragic 25.4% |
| Hawaiians | 0.2 /100 | #264 | Tragic 25.5% |
| Guatemalans | 0.2 /100 | #265 | Tragic 25.5% |
| Immigrants | Latin America | 0.1 /100 | #266 | Tragic 25.6% |
| Ottawa | 0.1 /100 | #267 | Tragic 25.6% |
| Liberians | 0.1 /100 | #268 | Tragic 25.6% |
| Hmong | 0.1 /100 | #269 | Tragic 25.7% |
| Immigrants | Guatemala | 0.1 /100 | #270 | Tragic 25.7% |
| Immigrants | Liberia | 0.1 /100 | #271 | Tragic 25.7% |
| Immigrants | Dominica | 0.1 /100 | #272 | Tragic 25.7% |
| Japanese | 0.1 /100 | #273 | Tragic 25.7% |
| Americans | 0.1 /100 | #274 | Tragic 25.8% |
| Hondurans | 0.1 /100 | #275 | Tragic 25.8% |
| French American Indians | 0.1 /100 | #276 | Tragic 25.8% |
| Belizeans | 0.1 /100 | #277 | Tragic 25.8% |
| Immigrants | Belize | 0.1 /100 | #278 | Tragic 25.8% |
| U.S. Virgin Islanders | 0.1 /100 | #279 | Tragic 25.9% |
| Cree | 0.1 /100 | #280 | Tragic 25.9% |
| Immigrants | Honduras | 0.1 /100 | #281 | Tragic 25.9% |
| Delaware | 0.1 /100 | #282 | Tragic 25.9% |
| Spanish Americans | 0.0 /100 | #283 | Tragic 25.9% |