Immigrants from Bulgaria vs Immigrants from Japan Female Poverty Among 25-34 Year Olds
COMPARE
Immigrants from Bulgaria
Immigrants from Japan
Female Poverty Among 25-34 Year Olds
Female Poverty Among 25-34 Year Olds Comparison
Immigrants from Bulgaria
Immigrants from Japan
11.8%
FEMALE POVERTY AMONG 25-34 YEAR OLDS
99.8/ 100
METRIC RATING
40th/ 347
METRIC RANK
11.6%
FEMALE POVERTY AMONG 25-34 YEAR OLDS
99.9/ 100
METRIC RATING
31st/ 347
METRIC RANK
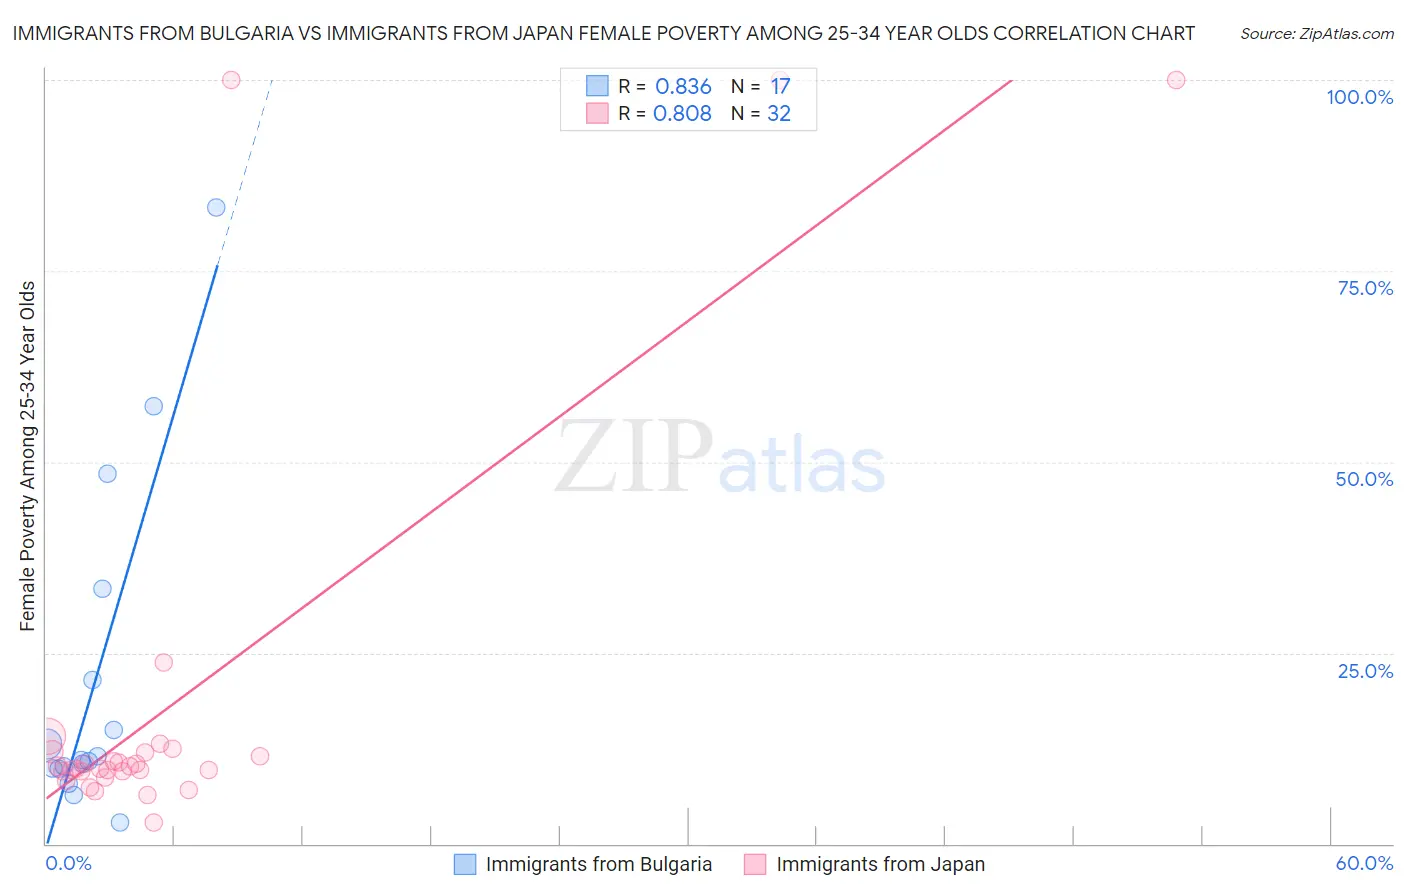
Immigrants from Bulgaria vs Immigrants from Japan Female Poverty Among 25-34 Year Olds Correlation Chart
The statistical analysis conducted on geographies consisting of 171,069,658 people shows a very strong positive correlation between the proportion of Immigrants from Bulgaria and poverty level among females between the ages 25 and 34 in the United States with a correlation coefficient (R) of 0.836 and weighted average of 11.8%. Similarly, the statistical analysis conducted on geographies consisting of 335,631,961 people shows a very strong positive correlation between the proportion of Immigrants from Japan and poverty level among females between the ages 25 and 34 in the United States with a correlation coefficient (R) of 0.808 and weighted average of 11.6%, a difference of 2.3%.
Female Poverty Among 25-34 Year Olds Correlation Summary
| Measurement | Immigrants from Bulgaria | Immigrants from Japan |
| Minimum | 2.9% | 2.8% |
| Maximum | 83.3% | 100.0% |
| Range | 80.5% | 97.3% |
| Mean | 21.3% | 18.6% |
| Median | 11.0% | 10.0% |
| Interquartile 25% (IQ1) | 9.8% | 9.4% |
| Interquartile 75% (IQ3) | 27.4% | 12.0% |
| Interquartile Range (IQR) | 17.6% | 2.5% |
| Standard Deviation (Sample) | 21.9% | 26.8% |
| Standard Deviation (Population) | 21.3% | 26.4% |
Demographics Similar to Immigrants from Bulgaria and Immigrants from Japan by Female Poverty Among 25-34 Year Olds
In terms of female poverty among 25-34 year olds, the demographic groups most similar to Immigrants from Bulgaria are Immigrants from Indonesia (11.8%, a difference of 0.13%), Latvian (11.8%, a difference of 0.16%), Immigrants from North Macedonia (11.8%, a difference of 0.41%), Immigrants from Turkey (11.9%, a difference of 0.42%), and Taiwanese (11.8%, a difference of 0.48%). Similarly, the demographic groups most similar to Immigrants from Japan are Cypriot (11.5%, a difference of 0.29%), Immigrants from Asia (11.6%, a difference of 0.30%), Bulgarian (11.5%, a difference of 0.31%), Immigrants from Pakistan (11.5%, a difference of 0.32%), and Immigrants from Greece (11.5%, a difference of 0.55%).
| Demographics | Rating | Rank | Female Poverty Among 25-34 Year Olds |
| Bhutanese | 99.9 /100 | #25 | Exceptional 11.4% |
| Tongans | 99.9 /100 | #26 | Exceptional 11.5% |
| Immigrants | Greece | 99.9 /100 | #27 | Exceptional 11.5% |
| Immigrants | Pakistan | 99.9 /100 | #28 | Exceptional 11.5% |
| Bulgarians | 99.9 /100 | #29 | Exceptional 11.5% |
| Cypriots | 99.9 /100 | #30 | Exceptional 11.5% |
| Immigrants | Japan | 99.9 /100 | #31 | Exceptional 11.6% |
| Immigrants | Asia | 99.9 /100 | #32 | Exceptional 11.6% |
| Immigrants | Poland | 99.9 /100 | #33 | Exceptional 11.6% |
| Zimbabweans | 99.9 /100 | #34 | Exceptional 11.7% |
| Cambodians | 99.9 /100 | #35 | Exceptional 11.7% |
| Immigrants | Sri Lanka | 99.8 /100 | #36 | Exceptional 11.8% |
| Taiwanese | 99.8 /100 | #37 | Exceptional 11.8% |
| Immigrants | North Macedonia | 99.8 /100 | #38 | Exceptional 11.8% |
| Latvians | 99.8 /100 | #39 | Exceptional 11.8% |
| Immigrants | Bulgaria | 99.8 /100 | #40 | Exceptional 11.8% |
| Immigrants | Indonesia | 99.8 /100 | #41 | Exceptional 11.8% |
| Immigrants | Turkey | 99.7 /100 | #42 | Exceptional 11.9% |
| Egyptians | 99.7 /100 | #43 | Exceptional 11.9% |
| Immigrants | Australia | 99.7 /100 | #44 | Exceptional 11.9% |
| Macedonians | 99.7 /100 | #45 | Exceptional 11.9% |