Immigrants from Belarus vs Immigrants from Cuba Disability Age Under 5
COMPARE
Immigrants from Belarus
Immigrants from Cuba
Disability Age Under 5
Disability Age Under 5 Comparison
Immigrants from Belarus
Immigrants from Cuba
1.0%
DISABILITY AGE UNDER 5
100.0/ 100
METRIC RATING
29th/ 347
METRIC RANK
1.1%
DISABILITY AGE UNDER 5
97.0/ 100
METRIC RATING
92nd/ 347
METRIC RANK
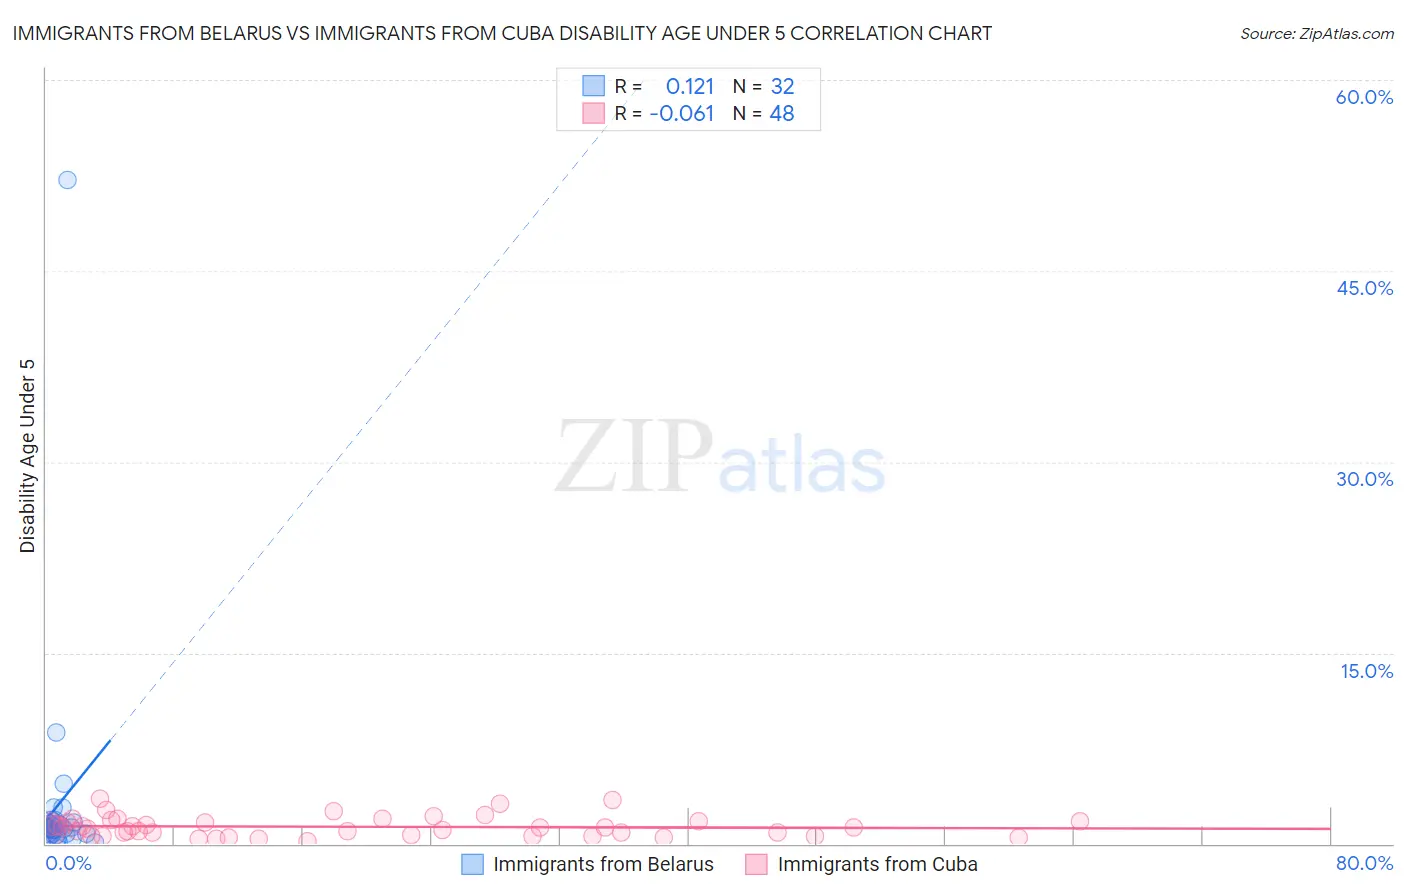
Immigrants from Belarus vs Immigrants from Cuba Disability Age Under 5 Correlation Chart
The statistical analysis conducted on geographies consisting of 102,408,276 people shows a poor positive correlation between the proportion of Immigrants from Belarus and percentage of population with a disability under the age of 5 in the United States with a correlation coefficient (R) of 0.121 and weighted average of 1.0%. Similarly, the statistical analysis conducted on geographies consisting of 186,893,063 people shows a slight negative correlation between the proportion of Immigrants from Cuba and percentage of population with a disability under the age of 5 in the United States with a correlation coefficient (R) of -0.061 and weighted average of 1.1%, a difference of 11.8%.
Disability Age Under 5 Correlation Summary
| Measurement | Immigrants from Belarus | Immigrants from Cuba |
| Minimum | 0.12% | 0.24% |
| Maximum | 52.1% | 3.6% |
| Range | 52.0% | 3.3% |
| Mean | 3.1% | 1.3% |
| Median | 1.2% | 1.2% |
| Interquartile 25% (IQ1) | 0.78% | 0.66% |
| Interquartile 75% (IQ3) | 1.6% | 1.8% |
| Interquartile Range (IQR) | 0.83% | 1.1% |
| Standard Deviation (Sample) | 9.1% | 0.80% |
| Standard Deviation (Population) | 8.9% | 0.79% |
Similar Demographics by Disability Age Under 5
Demographics Similar to Immigrants from Belarus by Disability Age Under 5
In terms of disability age under 5, the demographic groups most similar to Immigrants from Belarus are Immigrants from Eastern Asia (1.0%, a difference of 0.12%), Immigrants from South Central Asia (1.0%, a difference of 0.52%), Guyanese (1.0%, a difference of 0.76%), Armenian (1.0%, a difference of 0.81%), and Iranian (1.0%, a difference of 0.86%).
| Demographics | Rating | Rank | Disability Age Under 5 |
| Immigrants | Iran | 100.0 /100 | #22 | Exceptional 1.00% |
| Yakama | 100.0 /100 | #23 | Exceptional 1.00% |
| Indians (Asian) | 100.0 /100 | #24 | Exceptional 1.0% |
| Immigrants | Micronesia | 100.0 /100 | #25 | Exceptional 1.0% |
| Immigrants | Taiwan | 100.0 /100 | #26 | Exceptional 1.0% |
| Guyanese | 100.0 /100 | #27 | Exceptional 1.0% |
| Immigrants | Eastern Asia | 100.0 /100 | #28 | Exceptional 1.0% |
| Immigrants | Belarus | 100.0 /100 | #29 | Exceptional 1.0% |
| Immigrants | South Central Asia | 99.9 /100 | #30 | Exceptional 1.0% |
| Armenians | 99.9 /100 | #31 | Exceptional 1.0% |
| Iranians | 99.9 /100 | #32 | Exceptional 1.0% |
| Bolivians | 99.9 /100 | #33 | Exceptional 1.0% |
| Immigrants | Ukraine | 99.9 /100 | #34 | Exceptional 1.0% |
| Barbadians | 99.9 /100 | #35 | Exceptional 1.0% |
| Immigrants | Nepal | 99.9 /100 | #36 | Exceptional 1.0% |
Demographics Similar to Immigrants from Cuba by Disability Age Under 5
In terms of disability age under 5, the demographic groups most similar to Immigrants from Cuba are Spanish American (1.1%, a difference of 0.030%), Sri Lankan (1.1%, a difference of 0.090%), Immigrants from Moldova (1.1%, a difference of 0.14%), Albanian (1.1%, a difference of 0.17%), and Chinese (1.1%, a difference of 0.21%).
| Demographics | Rating | Rank | Disability Age Under 5 |
| Sudanese | 97.7 /100 | #85 | Exceptional 1.1% |
| Okinawans | 97.6 /100 | #86 | Exceptional 1.1% |
| Ugandans | 97.5 /100 | #87 | Exceptional 1.1% |
| Immigrants | Dominican Republic | 97.5 /100 | #88 | Exceptional 1.1% |
| Ethiopians | 97.2 /100 | #89 | Exceptional 1.1% |
| Chinese | 97.2 /100 | #90 | Exceptional 1.1% |
| Albanians | 97.2 /100 | #91 | Exceptional 1.1% |
| Immigrants | Cuba | 97.0 /100 | #92 | Exceptional 1.1% |
| Spanish Americans | 96.9 /100 | #93 | Exceptional 1.1% |
| Sri Lankans | 96.8 /100 | #94 | Exceptional 1.1% |
| Immigrants | Moldova | 96.8 /100 | #95 | Exceptional 1.1% |
| Mongolians | 96.6 /100 | #96 | Exceptional 1.1% |
| Immigrants | Iraq | 96.5 /100 | #97 | Exceptional 1.1% |
| Immigrants | South Eastern Asia | 96.5 /100 | #98 | Exceptional 1.1% |
| Dominicans | 96.3 /100 | #99 | Exceptional 1.1% |