Immigrants from Bangladesh vs Menominee Female Poverty Among 25-34 Year Olds
COMPARE
Immigrants from Bangladesh
Menominee
Female Poverty Among 25-34 Year Olds
Female Poverty Among 25-34 Year Olds Comparison
Immigrants from Bangladesh
Menominee
14.8%
FEMALE POVERTY AMONG 25-34 YEAR OLDS
1.1/ 100
METRIC RATING
244th/ 347
METRIC RANK
18.0%
FEMALE POVERTY AMONG 25-34 YEAR OLDS
0.0/ 100
METRIC RATING
319th/ 347
METRIC RANK
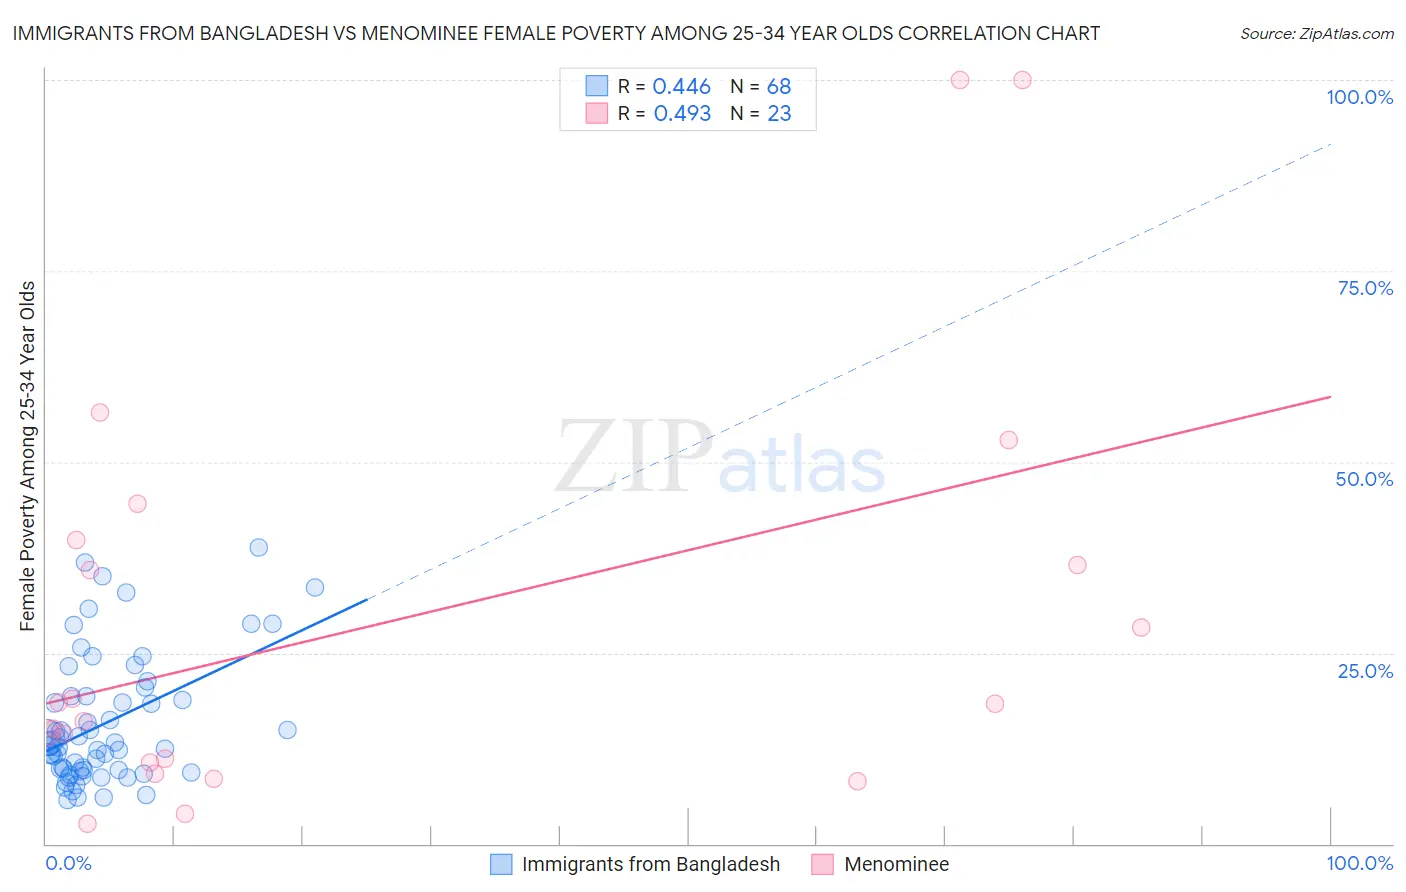
Immigrants from Bangladesh vs Menominee Female Poverty Among 25-34 Year Olds Correlation Chart
The statistical analysis conducted on geographies consisting of 202,108,312 people shows a moderate positive correlation between the proportion of Immigrants from Bangladesh and poverty level among females between the ages 25 and 34 in the United States with a correlation coefficient (R) of 0.446 and weighted average of 14.8%. Similarly, the statistical analysis conducted on geographies consisting of 45,599,400 people shows a moderate positive correlation between the proportion of Menominee and poverty level among females between the ages 25 and 34 in the United States with a correlation coefficient (R) of 0.493 and weighted average of 18.0%, a difference of 21.5%.
Female Poverty Among 25-34 Year Olds Correlation Summary
| Measurement | Immigrants from Bangladesh | Menominee |
| Minimum | 5.7% | 2.7% |
| Maximum | 38.8% | 100.0% |
| Range | 33.0% | 97.3% |
| Mean | 15.8% | 28.9% |
| Median | 12.9% | 18.4% |
| Interquartile 25% (IQ1) | 9.6% | 10.6% |
| Interquartile 75% (IQ3) | 19.2% | 39.8% |
| Interquartile Range (IQR) | 9.6% | 29.2% |
| Standard Deviation (Sample) | 8.3% | 27.1% |
| Standard Deviation (Population) | 8.2% | 26.5% |
Similar Demographics by Female Poverty Among 25-34 Year Olds
Demographics Similar to Immigrants from Bangladesh by Female Poverty Among 25-34 Year Olds
In terms of female poverty among 25-34 year olds, the demographic groups most similar to Immigrants from Bangladesh are Immigrants from Nicaragua (14.8%, a difference of 0.010%), Scotch-Irish (14.8%, a difference of 0.040%), Barbadian (14.8%, a difference of 0.040%), Immigrants from Middle Africa (14.8%, a difference of 0.18%), and Jamaican (14.8%, a difference of 0.22%).
| Demographics | Rating | Rank | Female Poverty Among 25-34 Year Olds |
| Immigrants | Ghana | 1.4 /100 | #237 | Tragic 14.7% |
| Alsatians | 1.4 /100 | #238 | Tragic 14.7% |
| Malaysians | 1.4 /100 | #239 | Tragic 14.7% |
| Immigrants | Grenada | 1.3 /100 | #240 | Tragic 14.7% |
| Scotch-Irish | 1.2 /100 | #241 | Tragic 14.8% |
| Barbadians | 1.2 /100 | #242 | Tragic 14.8% |
| Immigrants | Nicaragua | 1.1 /100 | #243 | Tragic 14.8% |
| Immigrants | Bangladesh | 1.1 /100 | #244 | Tragic 14.8% |
| Immigrants | Middle Africa | 1.0 /100 | #245 | Tragic 14.8% |
| Jamaicans | 1.0 /100 | #246 | Tragic 14.8% |
| German Russians | 0.8 /100 | #247 | Tragic 14.9% |
| Immigrants | Western Africa | 0.8 /100 | #248 | Tragic 14.9% |
| Immigrants | Haiti | 0.5 /100 | #249 | Tragic 15.0% |
| Immigrants | El Salvador | 0.5 /100 | #250 | Tragic 15.0% |
| Haitians | 0.5 /100 | #251 | Tragic 15.0% |
Demographics Similar to Menominee by Female Poverty Among 25-34 Year Olds
In terms of female poverty among 25-34 year olds, the demographic groups most similar to Menominee are Chippewa (18.0%, a difference of 0.26%), Choctaw (18.1%, a difference of 0.47%), Ute (17.9%, a difference of 0.55%), Arapaho (17.8%, a difference of 1.1%), and Central American Indian (18.2%, a difference of 1.3%).
| Demographics | Rating | Rank | Female Poverty Among 25-34 Year Olds |
| Iroquois | 0.0 /100 | #312 | Tragic 17.5% |
| Colville | 0.0 /100 | #313 | Tragic 17.5% |
| Immigrants | Dominican Republic | 0.0 /100 | #314 | Tragic 17.6% |
| Yakama | 0.0 /100 | #315 | Tragic 17.6% |
| Dominicans | 0.0 /100 | #316 | Tragic 17.6% |
| Arapaho | 0.0 /100 | #317 | Tragic 17.8% |
| Ute | 0.0 /100 | #318 | Tragic 17.9% |
| Menominee | 0.0 /100 | #319 | Tragic 18.0% |
| Chippewa | 0.0 /100 | #320 | Tragic 18.0% |
| Choctaw | 0.0 /100 | #321 | Tragic 18.1% |
| Central American Indians | 0.0 /100 | #322 | Tragic 18.2% |
| Seminole | 0.0 /100 | #323 | Tragic 18.3% |
| Dutch West Indians | 0.0 /100 | #324 | Tragic 18.4% |
| Inupiat | 0.0 /100 | #325 | Tragic 18.5% |
| Blacks/African Americans | 0.0 /100 | #326 | Tragic 18.9% |