Immigrants from Bangladesh vs Salvadoran Hearing Disability
COMPARE
Immigrants from Bangladesh
Salvadoran
Hearing Disability
Hearing Disability Comparison
Immigrants from Bangladesh
Salvadorans
2.4%
HEARING DISABILITY
100.0/ 100
METRIC RATING
7th/ 347
METRIC RANK
2.6%
HEARING DISABILITY
99.6/ 100
METRIC RATING
35th/ 347
METRIC RANK
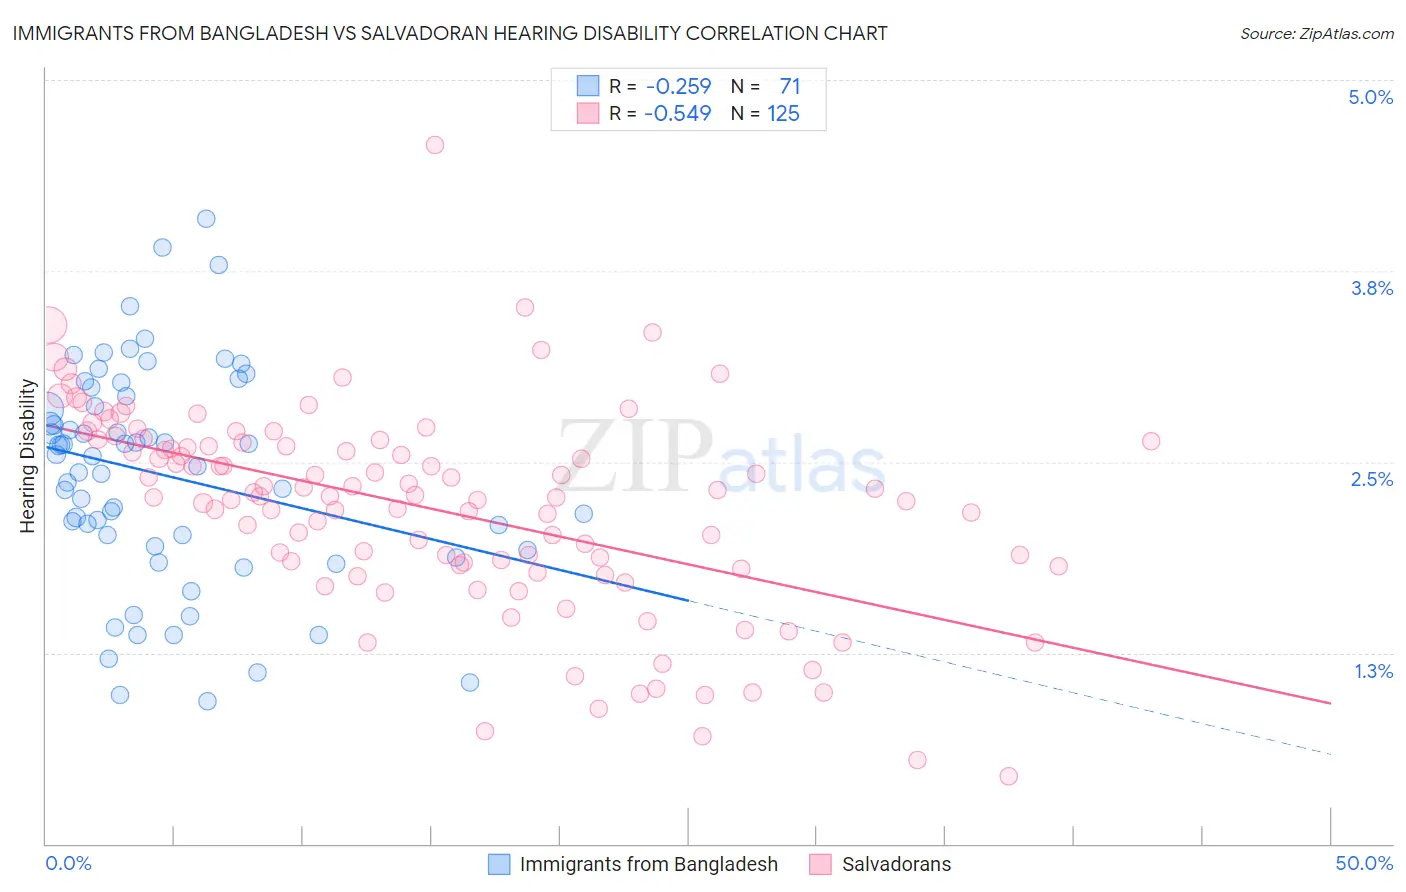
Immigrants from Bangladesh vs Salvadoran Hearing Disability Correlation Chart
The statistical analysis conducted on geographies consisting of 203,627,622 people shows a weak negative correlation between the proportion of Immigrants from Bangladesh and percentage of population with hearing disability in the United States with a correlation coefficient (R) of -0.259 and weighted average of 2.4%. Similarly, the statistical analysis conducted on geographies consisting of 398,804,647 people shows a substantial negative correlation between the proportion of Salvadorans and percentage of population with hearing disability in the United States with a correlation coefficient (R) of -0.549 and weighted average of 2.6%, a difference of 7.6%.
Hearing Disability Correlation Summary
| Measurement | Immigrants from Bangladesh | Salvadoran |
| Minimum | 0.93% | 0.44% |
| Maximum | 4.1% | 4.6% |
| Range | 3.2% | 4.1% |
| Mean | 2.4% | 2.2% |
| Median | 2.5% | 2.3% |
| Interquartile 25% (IQ1) | 1.9% | 1.8% |
| Interquartile 75% (IQ3) | 2.9% | 2.6% |
| Interquartile Range (IQR) | 0.98% | 0.81% |
| Standard Deviation (Sample) | 0.71% | 0.67% |
| Standard Deviation (Population) | 0.70% | 0.67% |
Similar Demographics by Hearing Disability
Demographics Similar to Immigrants from Bangladesh by Hearing Disability
In terms of hearing disability, the demographic groups most similar to Immigrants from Bangladesh are British West Indian (2.4%, a difference of 0.22%), Immigrants from Dominican Republic (2.4%, a difference of 1.0%), Vietnamese (2.4%, a difference of 1.6%), Immigrants from Ecuador (2.5%, a difference of 2.0%), and Immigrants from Trinidad and Tobago (2.5%, a difference of 2.6%).
| Demographics | Rating | Rank | Hearing Disability |
| Immigrants | Grenada | 100.0 /100 | #1 | Exceptional 2.2% |
| Immigrants | St. Vincent and the Grenadines | 100.0 /100 | #2 | Exceptional 2.3% |
| Guyanese | 100.0 /100 | #3 | Exceptional 2.3% |
| Immigrants | Guyana | 100.0 /100 | #4 | Exceptional 2.3% |
| Immigrants | Barbados | 100.0 /100 | #5 | Exceptional 2.4% |
| Vietnamese | 100.0 /100 | #6 | Exceptional 2.4% |
| Immigrants | Bangladesh | 100.0 /100 | #7 | Exceptional 2.4% |
| British West Indians | 100.0 /100 | #8 | Exceptional 2.4% |
| Immigrants | Dominican Republic | 100.0 /100 | #9 | Exceptional 2.4% |
| Immigrants | Ecuador | 99.9 /100 | #10 | Exceptional 2.5% |
| Immigrants | Trinidad and Tobago | 99.9 /100 | #11 | Exceptional 2.5% |
| Trinidadians and Tobagonians | 99.9 /100 | #12 | Exceptional 2.5% |
| Sierra Leoneans | 99.9 /100 | #13 | Exceptional 2.5% |
| Ecuadorians | 99.9 /100 | #14 | Exceptional 2.5% |
| Barbadians | 99.9 /100 | #15 | Exceptional 2.5% |
Demographics Similar to Salvadorans by Hearing Disability
In terms of hearing disability, the demographic groups most similar to Salvadorans are Immigrants from Pakistan (2.6%, a difference of 0.12%), Filipino (2.6%, a difference of 0.16%), Okinawan (2.6%, a difference of 0.22%), Immigrants from Western Africa (2.6%, a difference of 0.25%), and Immigrants from Jamaica (2.6%, a difference of 0.33%).
| Demographics | Rating | Rank | Hearing Disability |
| Immigrants | Haiti | 99.7 /100 | #28 | Exceptional 2.6% |
| Bolivians | 99.7 /100 | #29 | Exceptional 2.6% |
| Immigrants | Caribbean | 99.7 /100 | #30 | Exceptional 2.6% |
| Immigrants | Cameroon | 99.7 /100 | #31 | Exceptional 2.6% |
| Immigrants | Venezuela | 99.7 /100 | #32 | Exceptional 2.6% |
| Filipinos | 99.6 /100 | #33 | Exceptional 2.6% |
| Immigrants | Pakistan | 99.6 /100 | #34 | Exceptional 2.6% |
| Salvadorans | 99.6 /100 | #35 | Exceptional 2.6% |
| Okinawans | 99.6 /100 | #36 | Exceptional 2.6% |
| Immigrants | Western Africa | 99.6 /100 | #37 | Exceptional 2.6% |
| Immigrants | Jamaica | 99.5 /100 | #38 | Exceptional 2.6% |
| Immigrants | China | 99.5 /100 | #39 | Exceptional 2.6% |
| Haitians | 99.5 /100 | #40 | Exceptional 2.6% |
| Immigrants | Taiwan | 99.4 /100 | #41 | Exceptional 2.6% |
| West Indians | 99.4 /100 | #42 | Exceptional 2.6% |