Basque vs Blackfeet Disability
COMPARE
Basque
Blackfeet
Disability
Disability Comparison
Basques
Blackfeet
12.2%
DISABILITY
1.5/ 100
METRIC RATING
244th/ 347
METRIC RANK
13.6%
DISABILITY
0.0/ 100
METRIC RATING
310th/ 347
METRIC RANK
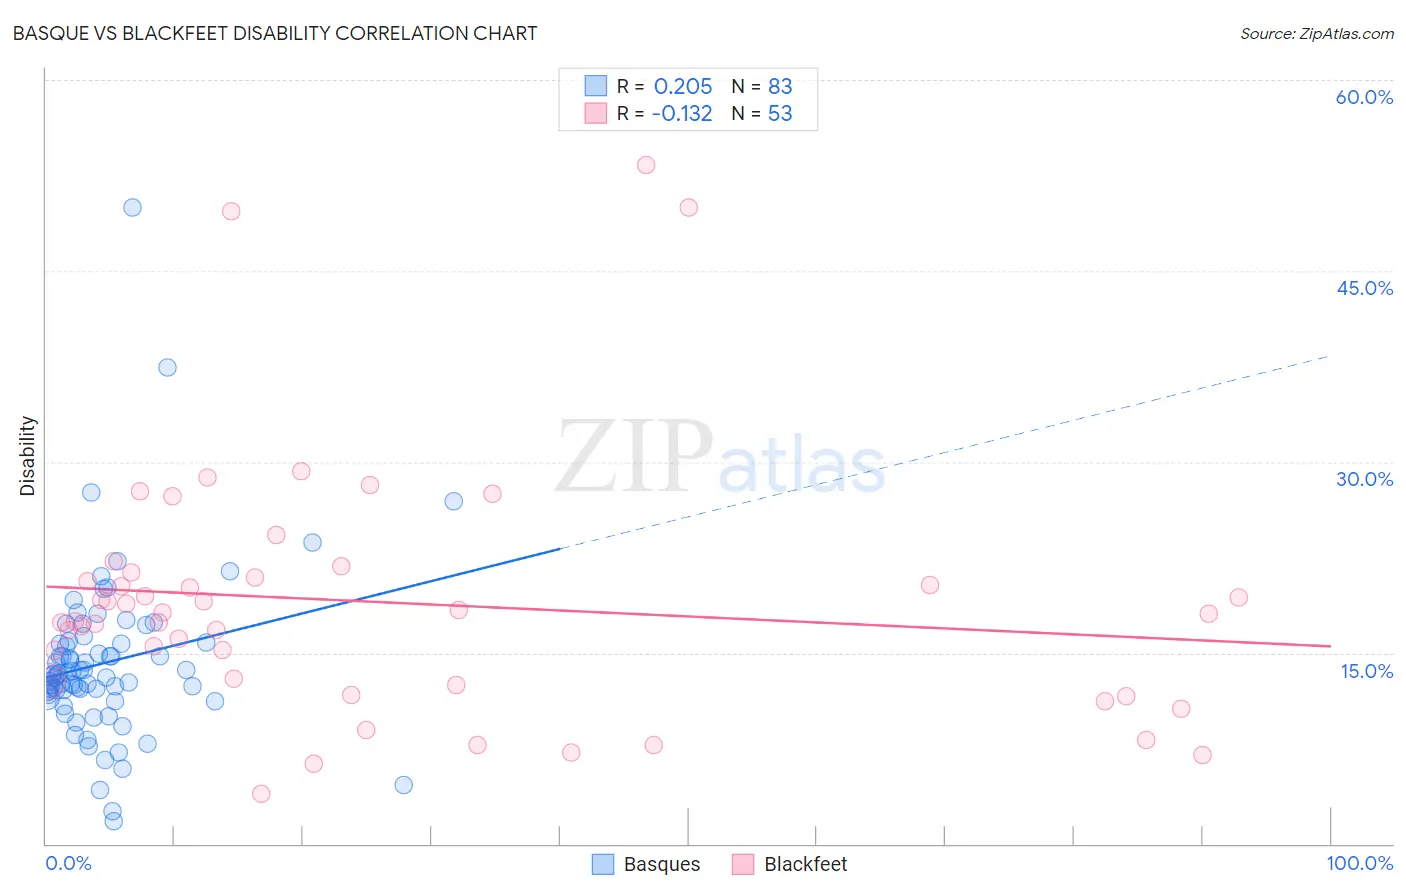
Basque vs Blackfeet Disability Correlation Chart
The statistical analysis conducted on geographies consisting of 165,778,985 people shows a weak positive correlation between the proportion of Basques and percentage of population with a disability in the United States with a correlation coefficient (R) of 0.205 and weighted average of 12.2%. Similarly, the statistical analysis conducted on geographies consisting of 309,516,327 people shows a poor negative correlation between the proportion of Blackfeet and percentage of population with a disability in the United States with a correlation coefficient (R) of -0.132 and weighted average of 13.6%, a difference of 11.2%.
Disability Correlation Summary
| Measurement | Basque | Blackfeet |
| Minimum | 1.7% | 4.0% |
| Maximum | 50.0% | 53.3% |
| Range | 48.3% | 49.4% |
| Mean | 14.2% | 19.0% |
| Median | 13.3% | 18.1% |
| Interquartile 25% (IQ1) | 11.7% | 12.6% |
| Interquartile 75% (IQ3) | 15.8% | 21.1% |
| Interquartile Range (IQR) | 4.1% | 8.5% |
| Standard Deviation (Sample) | 6.6% | 10.0% |
| Standard Deviation (Population) | 6.6% | 9.9% |
Similar Demographics by Disability
Demographics Similar to Basques by Disability
In terms of disability, the demographic groups most similar to Basques are British (12.2%, a difference of 0.0%), Liberian (12.2%, a difference of 0.020%), Swiss (12.2%, a difference of 0.040%), Indonesian (12.2%, a difference of 0.070%), and Polish (12.2%, a difference of 0.090%).
| Demographics | Rating | Rank | Disability |
| Immigrants | Congo | 1.9 /100 | #237 | Tragic 12.2% |
| Norwegians | 1.9 /100 | #238 | Tragic 12.2% |
| Swedes | 1.8 /100 | #239 | Tragic 12.2% |
| Hungarians | 1.7 /100 | #240 | Tragic 12.2% |
| Yugoslavians | 1.7 /100 | #241 | Tragic 12.2% |
| Poles | 1.7 /100 | #242 | Tragic 12.2% |
| British | 1.5 /100 | #243 | Tragic 12.2% |
| Basques | 1.5 /100 | #244 | Tragic 12.2% |
| Liberians | 1.5 /100 | #245 | Tragic 12.2% |
| Swiss | 1.5 /100 | #246 | Tragic 12.2% |
| Indonesians | 1.4 /100 | #247 | Tragic 12.2% |
| Guamanians/Chamorros | 1.4 /100 | #248 | Tragic 12.3% |
| Carpatho Rusyns | 1.4 /100 | #249 | Tragic 12.3% |
| Sub-Saharan Africans | 1.4 /100 | #250 | Tragic 12.3% |
| Europeans | 1.4 /100 | #251 | Tragic 12.3% |
Demographics Similar to Blackfeet by Disability
In terms of disability, the demographic groups most similar to Blackfeet are Delaware (13.6%, a difference of 0.040%), Spanish American (13.6%, a difference of 0.28%), Tlingit-Haida (13.5%, a difference of 0.53%), French American Indian (13.5%, a difference of 0.61%), and Cree (13.7%, a difference of 0.63%).
| Demographics | Rating | Rank | Disability |
| Scotch-Irish | 0.0 /100 | #303 | Tragic 13.3% |
| Yakama | 0.0 /100 | #304 | Tragic 13.4% |
| French Canadians | 0.0 /100 | #305 | Tragic 13.4% |
| Cape Verdeans | 0.0 /100 | #306 | Tragic 13.5% |
| Shoshone | 0.0 /100 | #307 | Tragic 13.5% |
| French American Indians | 0.0 /100 | #308 | Tragic 13.5% |
| Tlingit-Haida | 0.0 /100 | #309 | Tragic 13.5% |
| Blackfeet | 0.0 /100 | #310 | Tragic 13.6% |
| Delaware | 0.0 /100 | #311 | Tragic 13.6% |
| Spanish Americans | 0.0 /100 | #312 | Tragic 13.6% |
| Cree | 0.0 /100 | #313 | Tragic 13.7% |
| Blacks/African Americans | 0.0 /100 | #314 | Tragic 13.7% |
| Puget Sound Salish | 0.0 /100 | #315 | Tragic 13.7% |
| Pima | 0.0 /100 | #316 | Tragic 13.7% |
| Immigrants | Cabo Verde | 0.0 /100 | #317 | Tragic 13.7% |