Immigrants from Czechoslovakia vs Blackfeet Disability
COMPARE
Immigrants from Czechoslovakia
Blackfeet
Disability
Disability Comparison
Immigrants from Czechoslovakia
Blackfeet
11.2%
DISABILITY
97.4/ 100
METRIC RATING
99th/ 347
METRIC RANK
13.6%
DISABILITY
0.0/ 100
METRIC RATING
310th/ 347
METRIC RANK
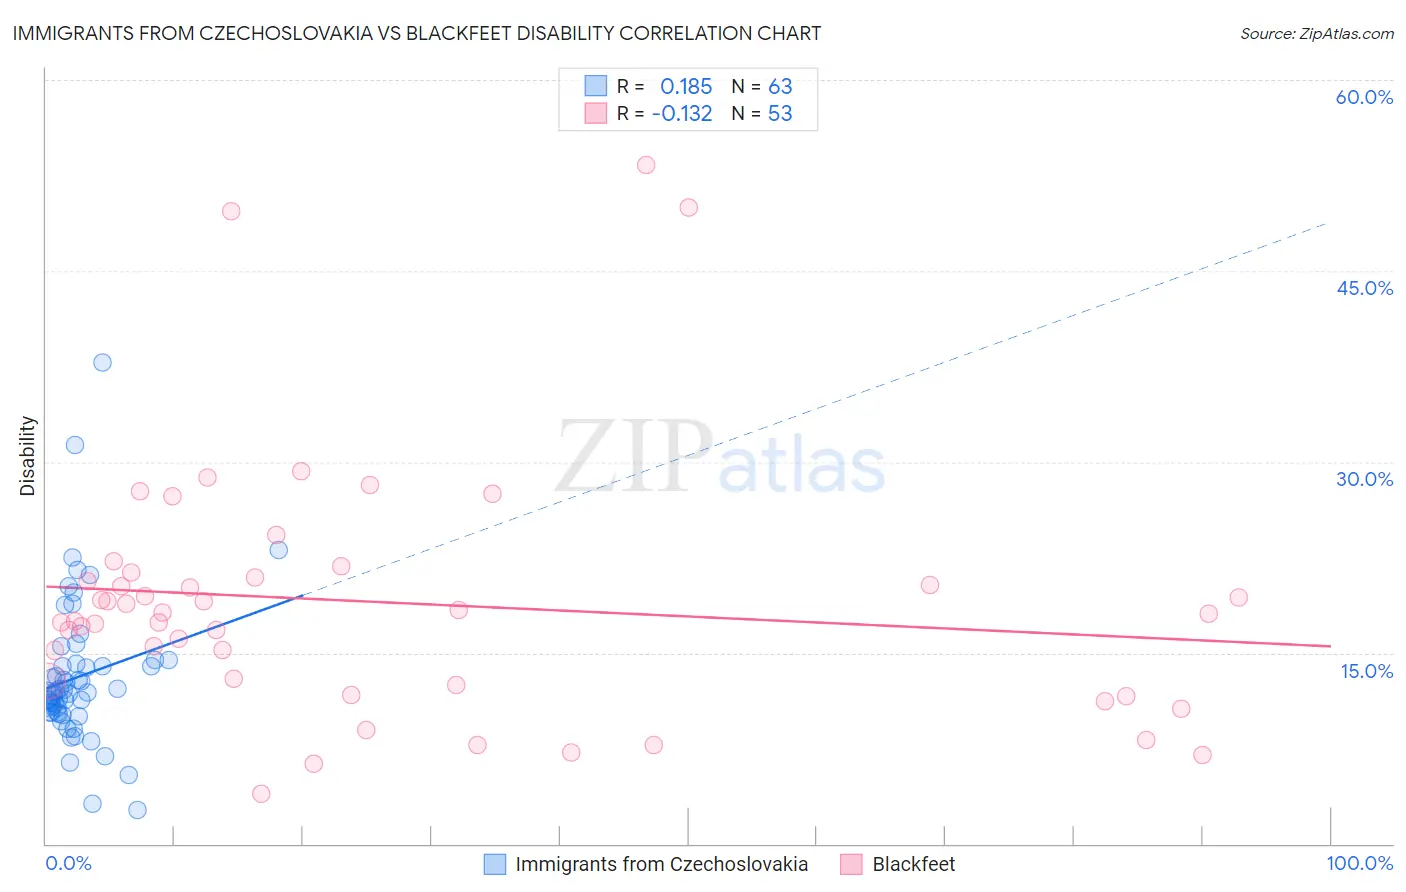
Immigrants from Czechoslovakia vs Blackfeet Disability Correlation Chart
The statistical analysis conducted on geographies consisting of 195,454,618 people shows a poor positive correlation between the proportion of Immigrants from Czechoslovakia and percentage of population with a disability in the United States with a correlation coefficient (R) of 0.185 and weighted average of 11.2%. Similarly, the statistical analysis conducted on geographies consisting of 309,516,327 people shows a poor negative correlation between the proportion of Blackfeet and percentage of population with a disability in the United States with a correlation coefficient (R) of -0.132 and weighted average of 13.6%, a difference of 21.2%.
Disability Correlation Summary
| Measurement | Immigrants from Czechoslovakia | Blackfeet |
| Minimum | 2.7% | 4.0% |
| Maximum | 37.8% | 53.3% |
| Range | 35.2% | 49.4% |
| Mean | 13.1% | 19.0% |
| Median | 11.9% | 18.1% |
| Interquartile 25% (IQ1) | 10.3% | 12.6% |
| Interquartile 75% (IQ3) | 14.2% | 21.1% |
| Interquartile Range (IQR) | 3.9% | 8.5% |
| Standard Deviation (Sample) | 5.7% | 10.0% |
| Standard Deviation (Population) | 5.7% | 9.9% |
Similar Demographics by Disability
Demographics Similar to Immigrants from Czechoslovakia by Disability
In terms of disability, the demographic groups most similar to Immigrants from Czechoslovakia are Bhutanese (11.2%, a difference of 0.010%), Uruguayan (11.2%, a difference of 0.010%), Immigrants from Zimbabwe (11.2%, a difference of 0.15%), Immigrants from Greece (11.3%, a difference of 0.18%), and Immigrants from Morocco (11.2%, a difference of 0.22%).
| Demographics | Rating | Rank | Disability |
| Ecuadorians | 98.0 /100 | #92 | Exceptional 11.2% |
| Immigrants | Ecuador | 98.0 /100 | #93 | Exceptional 11.2% |
| Immigrants | Morocco | 97.8 /100 | #94 | Exceptional 11.2% |
| Eastern Europeans | 97.8 /100 | #95 | Exceptional 11.2% |
| Immigrants | Zimbabwe | 97.7 /100 | #96 | Exceptional 11.2% |
| Bhutanese | 97.4 /100 | #97 | Exceptional 11.2% |
| Uruguayans | 97.4 /100 | #98 | Exceptional 11.2% |
| Immigrants | Czechoslovakia | 97.4 /100 | #99 | Exceptional 11.2% |
| Immigrants | Greece | 96.9 /100 | #100 | Exceptional 11.3% |
| Immigrants | Nicaragua | 96.8 /100 | #101 | Exceptional 11.3% |
| Immigrants | Eastern Africa | 96.7 /100 | #102 | Exceptional 11.3% |
| Immigrants | Uruguay | 96.4 /100 | #103 | Exceptional 11.3% |
| Immigrants | Immigrants | 96.4 /100 | #104 | Exceptional 11.3% |
| Immigrants | Kazakhstan | 96.4 /100 | #105 | Exceptional 11.3% |
| Immigrants | Eastern Europe | 96.3 /100 | #106 | Exceptional 11.3% |
Demographics Similar to Blackfeet by Disability
In terms of disability, the demographic groups most similar to Blackfeet are Delaware (13.6%, a difference of 0.040%), Spanish American (13.6%, a difference of 0.28%), Tlingit-Haida (13.5%, a difference of 0.53%), French American Indian (13.5%, a difference of 0.61%), and Cree (13.7%, a difference of 0.63%).
| Demographics | Rating | Rank | Disability |
| Scotch-Irish | 0.0 /100 | #303 | Tragic 13.3% |
| Yakama | 0.0 /100 | #304 | Tragic 13.4% |
| French Canadians | 0.0 /100 | #305 | Tragic 13.4% |
| Cape Verdeans | 0.0 /100 | #306 | Tragic 13.5% |
| Shoshone | 0.0 /100 | #307 | Tragic 13.5% |
| French American Indians | 0.0 /100 | #308 | Tragic 13.5% |
| Tlingit-Haida | 0.0 /100 | #309 | Tragic 13.5% |
| Blackfeet | 0.0 /100 | #310 | Tragic 13.6% |
| Delaware | 0.0 /100 | #311 | Tragic 13.6% |
| Spanish Americans | 0.0 /100 | #312 | Tragic 13.6% |
| Cree | 0.0 /100 | #313 | Tragic 13.7% |
| Blacks/African Americans | 0.0 /100 | #314 | Tragic 13.7% |
| Puget Sound Salish | 0.0 /100 | #315 | Tragic 13.7% |
| Pima | 0.0 /100 | #316 | Tragic 13.7% |
| Immigrants | Cabo Verde | 0.0 /100 | #317 | Tragic 13.7% |