Immigrants from Bahamas vs West Indian Hearing Disability
COMPARE
Immigrants from Bahamas
West Indian
Hearing Disability
Hearing Disability Comparison
Immigrants from Bahamas
West Indians
2.9%
HEARING DISABILITY
80.9/ 100
METRIC RATING
143rd/ 347
METRIC RANK
2.6%
HEARING DISABILITY
99.4/ 100
METRIC RATING
42nd/ 347
METRIC RANK
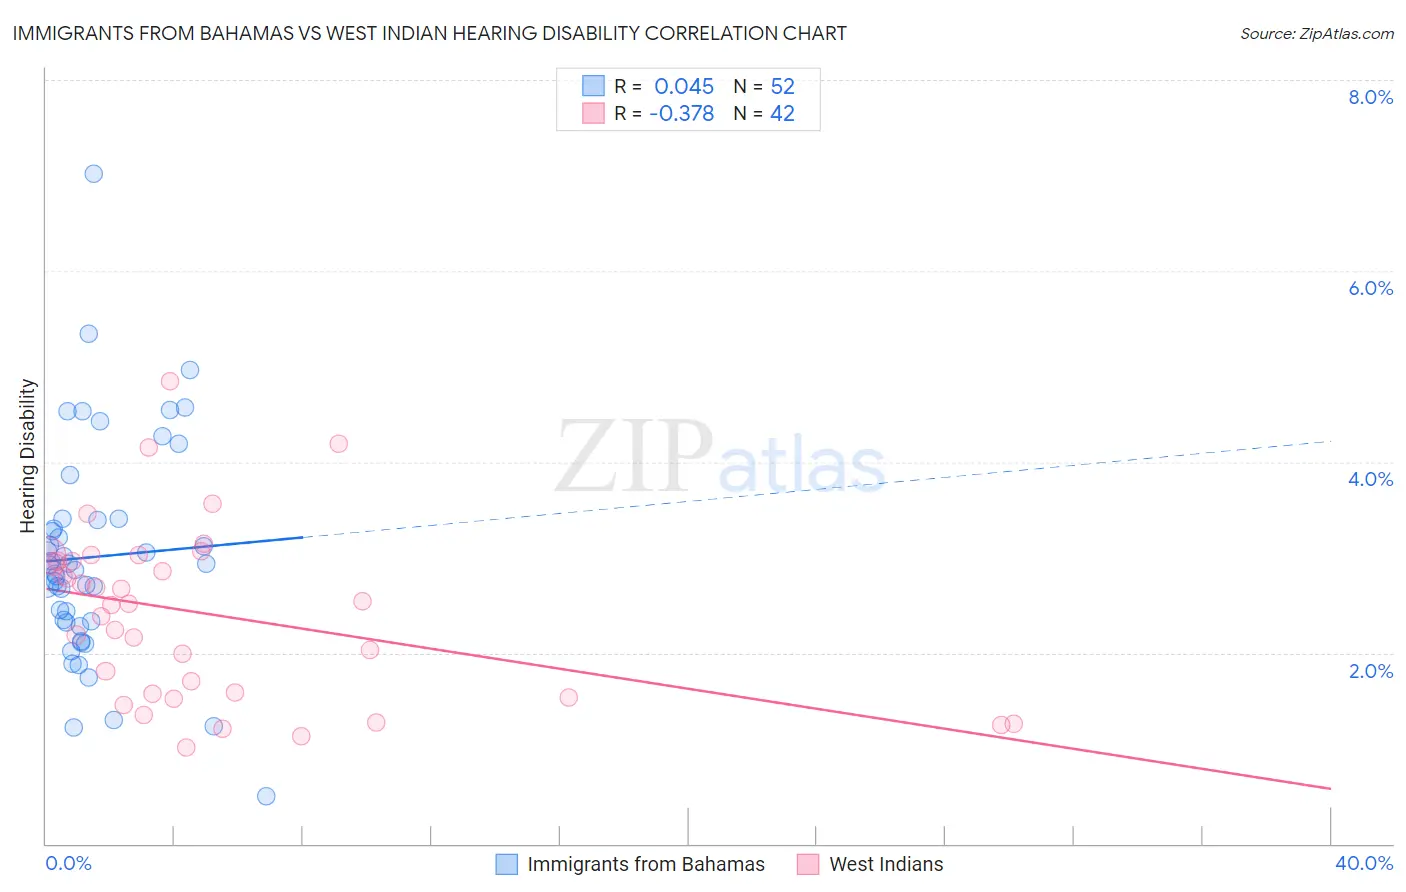
Immigrants from Bahamas vs West Indian Hearing Disability Correlation Chart
The statistical analysis conducted on geographies consisting of 104,634,972 people shows no correlation between the proportion of Immigrants from Bahamas and percentage of population with hearing disability in the United States with a correlation coefficient (R) of 0.045 and weighted average of 2.9%. Similarly, the statistical analysis conducted on geographies consisting of 253,938,353 people shows a mild negative correlation between the proportion of West Indians and percentage of population with hearing disability in the United States with a correlation coefficient (R) of -0.378 and weighted average of 2.6%, a difference of 9.8%.
Hearing Disability Correlation Summary
| Measurement | Immigrants from Bahamas | West Indian |
| Minimum | 0.49% | 1.0% |
| Maximum | 7.0% | 4.8% |
| Range | 6.5% | 3.8% |
| Mean | 3.0% | 2.4% |
| Median | 2.9% | 2.5% |
| Interquartile 25% (IQ1) | 2.3% | 1.6% |
| Interquartile 75% (IQ3) | 3.4% | 3.0% |
| Interquartile Range (IQR) | 1.1% | 1.4% |
| Standard Deviation (Sample) | 1.2% | 0.91% |
| Standard Deviation (Population) | 1.1% | 0.90% |
Similar Demographics by Hearing Disability
Demographics Similar to Immigrants from Bahamas by Hearing Disability
In terms of hearing disability, the demographic groups most similar to Immigrants from Bahamas are Laotian (2.9%, a difference of 0.020%), Immigrants from Bulgaria (2.9%, a difference of 0.27%), Immigrants from Congo (2.9%, a difference of 0.31%), Brazilian (2.9%, a difference of 0.33%), and Tongan (2.9%, a difference of 0.35%).
| Demographics | Rating | Rank | Hearing Disability |
| Immigrants | Brazil | 84.6 /100 | #136 | Excellent 2.9% |
| Sri Lankans | 84.1 /100 | #137 | Excellent 2.9% |
| Immigrants | Costa Rica | 84.0 /100 | #138 | Excellent 2.9% |
| Bermudans | 83.8 /100 | #139 | Excellent 2.9% |
| Immigrants | Jordan | 83.7 /100 | #140 | Excellent 2.9% |
| Sub-Saharan Africans | 83.3 /100 | #141 | Excellent 2.9% |
| Laotians | 81.1 /100 | #142 | Excellent 2.9% |
| Immigrants | Bahamas | 80.9 /100 | #143 | Excellent 2.9% |
| Immigrants | Bulgaria | 79.2 /100 | #144 | Good 2.9% |
| Immigrants | Congo | 78.9 /100 | #145 | Good 2.9% |
| Brazilians | 78.7 /100 | #146 | Good 2.9% |
| Tongans | 78.6 /100 | #147 | Good 2.9% |
| Immigrants | Russia | 77.7 /100 | #148 | Good 2.9% |
| Immigrants | Panama | 76.9 /100 | #149 | Good 2.9% |
| Palestinians | 73.6 /100 | #150 | Good 2.9% |
Demographics Similar to West Indians by Hearing Disability
In terms of hearing disability, the demographic groups most similar to West Indians are Immigrants from Taiwan (2.6%, a difference of 0.010%), Senegalese (2.6%, a difference of 0.010%), Nigerian (2.6%, a difference of 0.23%), Venezuelan (2.6%, a difference of 0.25%), and Haitian (2.6%, a difference of 0.34%).
| Demographics | Rating | Rank | Hearing Disability |
| Salvadorans | 99.6 /100 | #35 | Exceptional 2.6% |
| Okinawans | 99.6 /100 | #36 | Exceptional 2.6% |
| Immigrants | Western Africa | 99.6 /100 | #37 | Exceptional 2.6% |
| Immigrants | Jamaica | 99.5 /100 | #38 | Exceptional 2.6% |
| Immigrants | China | 99.5 /100 | #39 | Exceptional 2.6% |
| Haitians | 99.5 /100 | #40 | Exceptional 2.6% |
| Immigrants | Taiwan | 99.4 /100 | #41 | Exceptional 2.6% |
| West Indians | 99.4 /100 | #42 | Exceptional 2.6% |
| Senegalese | 99.4 /100 | #43 | Exceptional 2.6% |
| Nigerians | 99.4 /100 | #44 | Exceptional 2.6% |
| Venezuelans | 99.4 /100 | #45 | Exceptional 2.6% |
| Immigrants | Dominica | 99.3 /100 | #46 | Exceptional 2.6% |
| Immigrants | Israel | 99.3 /100 | #47 | Exceptional 2.6% |
| Immigrants | Singapore | 99.3 /100 | #48 | Exceptional 2.6% |
| Immigrants | South America | 99.2 /100 | #49 | Exceptional 2.7% |