Immigrants from Bahamas vs Fijian Disability Age 5 to 17
COMPARE
Immigrants from Bahamas
Fijian
Disability Age 5 to 17
Disability Age 5 to 17 Comparison
Immigrants from Bahamas
Fijians
6.2%
DISABILITY AGE 5 TO 17
0.0/ 100
METRIC RATING
297th/ 347
METRIC RANK
5.7%
DISABILITY AGE 5 TO 17
31.7/ 100
METRIC RATING
186th/ 347
METRIC RANK
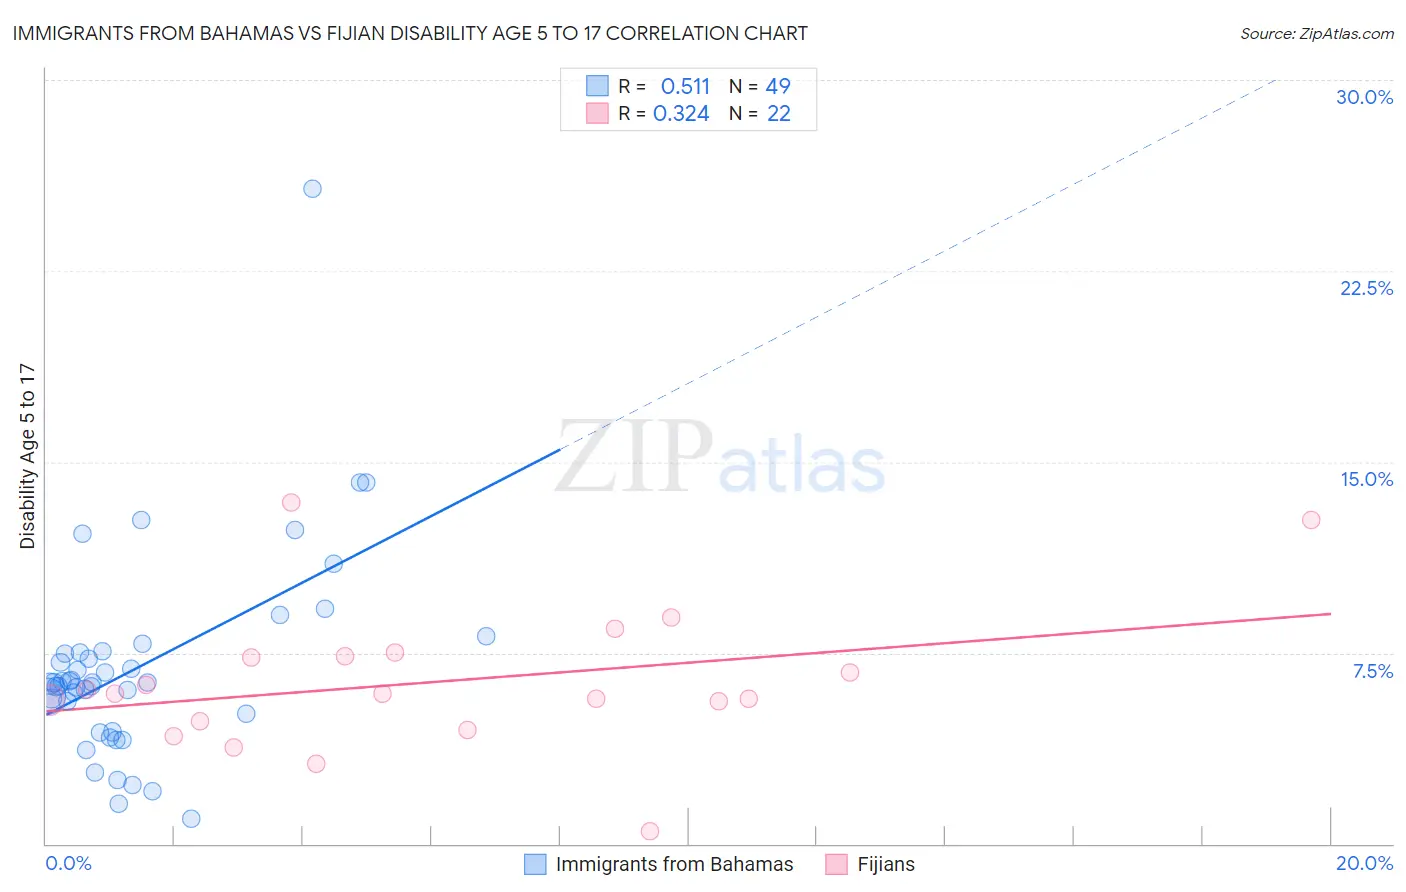
Immigrants from Bahamas vs Fijian Disability Age 5 to 17 Correlation Chart
The statistical analysis conducted on geographies consisting of 104,453,975 people shows a substantial positive correlation between the proportion of Immigrants from Bahamas and percentage of population with a disability between the ages 5 and 17 in the United States with a correlation coefficient (R) of 0.511 and weighted average of 6.2%. Similarly, the statistical analysis conducted on geographies consisting of 55,882,299 people shows a mild positive correlation between the proportion of Fijians and percentage of population with a disability between the ages 5 and 17 in the United States with a correlation coefficient (R) of 0.324 and weighted average of 5.7%, a difference of 10.4%.
Disability Age 5 to 17 Correlation Summary
| Measurement | Immigrants from Bahamas | Fijian |
| Minimum | 0.96% | 0.51% |
| Maximum | 25.7% | 13.4% |
| Range | 24.8% | 12.9% |
| Mean | 6.9% | 6.4% |
| Median | 6.3% | 5.9% |
| Interquartile 25% (IQ1) | 4.7% | 4.8% |
| Interquartile 75% (IQ3) | 7.5% | 7.4% |
| Interquartile Range (IQR) | 2.8% | 2.6% |
| Standard Deviation (Sample) | 4.0% | 2.8% |
| Standard Deviation (Population) | 4.0% | 2.8% |
Similar Demographics by Disability Age 5 to 17
Demographics Similar to Immigrants from Bahamas by Disability Age 5 to 17
In terms of disability age 5 to 17, the demographic groups most similar to Immigrants from Bahamas are Lumbee (6.2%, a difference of 0.070%), Spanish American (6.2%, a difference of 0.12%), Cree (6.2%, a difference of 0.15%), Welsh (6.3%, a difference of 0.22%), and Carpatho Rusyn (6.3%, a difference of 0.34%).
| Demographics | Rating | Rank | Disability Age 5 to 17 |
| Immigrants | Congo | 0.0 /100 | #290 | Tragic 6.2% |
| Whites/Caucasians | 0.0 /100 | #291 | Tragic 6.2% |
| Immigrants | Senegal | 0.0 /100 | #292 | Tragic 6.2% |
| Central American Indians | 0.0 /100 | #293 | Tragic 6.2% |
| Irish | 0.0 /100 | #294 | Tragic 6.2% |
| Cree | 0.0 /100 | #295 | Tragic 6.2% |
| Spanish Americans | 0.0 /100 | #296 | Tragic 6.2% |
| Immigrants | Bahamas | 0.0 /100 | #297 | Tragic 6.2% |
| Lumbee | 0.0 /100 | #298 | Tragic 6.2% |
| Welsh | 0.0 /100 | #299 | Tragic 6.3% |
| Carpatho Rusyns | 0.0 /100 | #300 | Tragic 6.3% |
| U.S. Virgin Islanders | 0.0 /100 | #301 | Tragic 6.3% |
| Celtics | 0.0 /100 | #302 | Tragic 6.3% |
| Yakama | 0.0 /100 | #303 | Tragic 6.3% |
| Senegalese | 0.0 /100 | #304 | Tragic 6.3% |
Demographics Similar to Fijians by Disability Age 5 to 17
In terms of disability age 5 to 17, the demographic groups most similar to Fijians are Immigrants from Thailand (5.7%, a difference of 0.090%), Immigrants from Mexico (5.6%, a difference of 0.11%), Syrian (5.6%, a difference of 0.12%), Immigrants from Latin America (5.6%, a difference of 0.14%), and Mexican American Indian (5.6%, a difference of 0.20%).
| Demographics | Rating | Rank | Disability Age 5 to 17 |
| Immigrants | Barbados | 40.5 /100 | #179 | Average 5.6% |
| Immigrants | Uruguay | 37.7 /100 | #180 | Fair 5.6% |
| Immigrants | England | 36.4 /100 | #181 | Fair 5.6% |
| Mexican American Indians | 35.2 /100 | #182 | Fair 5.6% |
| Immigrants | Latin America | 34.3 /100 | #183 | Fair 5.6% |
| Syrians | 33.8 /100 | #184 | Fair 5.6% |
| Immigrants | Mexico | 33.7 /100 | #185 | Fair 5.6% |
| Fijians | 31.7 /100 | #186 | Fair 5.7% |
| Immigrants | Thailand | 30.2 /100 | #187 | Fair 5.7% |
| Marshallese | 28.1 /100 | #188 | Fair 5.7% |
| Pueblo | 27.5 /100 | #189 | Fair 5.7% |
| Immigrants | Eastern Africa | 27.3 /100 | #190 | Fair 5.7% |
| Danes | 26.5 /100 | #191 | Fair 5.7% |
| Immigrants | Bosnia and Herzegovina | 26.3 /100 | #192 | Fair 5.7% |
| Immigrants | Canada | 26.1 /100 | #193 | Fair 5.7% |