Immigrants from Austria vs Immigrants from Italy Female Disability
COMPARE
Immigrants from Austria
Immigrants from Italy
Female Disability
Female Disability Comparison
Immigrants from Austria
Immigrants from Italy
12.0%
FEMALE DISABILITY
87.9/ 100
METRIC RATING
144th/ 347
METRIC RANK
11.8%
FEMALE DISABILITY
96.4/ 100
METRIC RATING
125th/ 347
METRIC RANK
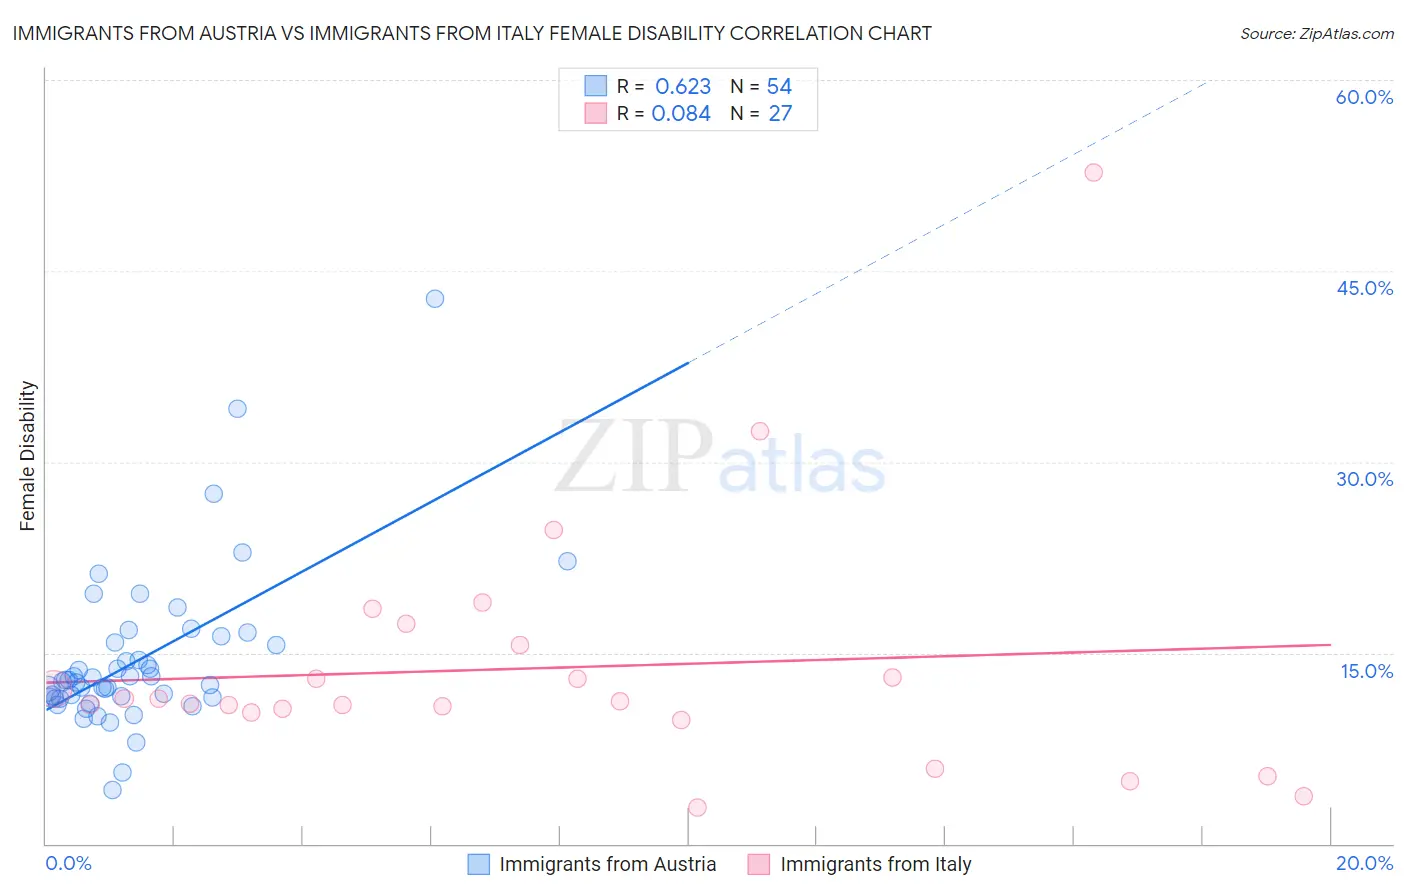
Immigrants from Austria vs Immigrants from Italy Female Disability Correlation Chart
The statistical analysis conducted on geographies consisting of 167,970,521 people shows a significant positive correlation between the proportion of Immigrants from Austria and percentage of females with a disability in the United States with a correlation coefficient (R) of 0.623 and weighted average of 12.0%. Similarly, the statistical analysis conducted on geographies consisting of 324,199,365 people shows a slight positive correlation between the proportion of Immigrants from Italy and percentage of females with a disability in the United States with a correlation coefficient (R) of 0.084 and weighted average of 11.8%, a difference of 1.3%.
Female Disability Correlation Summary
| Measurement | Immigrants from Austria | Immigrants from Italy |
| Minimum | 4.2% | 2.9% |
| Maximum | 42.9% | 52.8% |
| Range | 38.7% | 49.9% |
| Mean | 14.5% | 13.8% |
| Median | 12.8% | 11.2% |
| Interquartile 25% (IQ1) | 11.5% | 10.3% |
| Interquartile 75% (IQ3) | 15.9% | 15.6% |
| Interquartile Range (IQR) | 4.4% | 5.3% |
| Standard Deviation (Sample) | 6.3% | 10.0% |
| Standard Deviation (Population) | 6.3% | 9.8% |
Demographics Similar to Immigrants from Austria and Immigrants from Italy by Female Disability
In terms of female disability, the demographic groups most similar to Immigrants from Austria are Immigrants from Sudan (11.9%, a difference of 0.17%), Immigrants from Africa (11.9%, a difference of 0.21%), Immigrants from Ecuador (11.9%, a difference of 0.38%), Romanian (11.9%, a difference of 0.40%), and Immigrants from Hungary (11.9%, a difference of 0.56%). Similarly, the demographic groups most similar to Immigrants from Italy are Russian (11.8%, a difference of 0.030%), Immigrants from Europe (11.8%, a difference of 0.060%), South American Indian (11.8%, a difference of 0.17%), Immigrants from Latvia (11.8%, a difference of 0.21%), and Macedonian (11.8%, a difference of 0.24%).
| Demographics | Rating | Rank | Female Disability |
| Russians | 96.5 /100 | #124 | Exceptional 11.8% |
| Immigrants | Italy | 96.4 /100 | #125 | Exceptional 11.8% |
| Immigrants | Europe | 96.2 /100 | #126 | Exceptional 11.8% |
| South American Indians | 95.8 /100 | #127 | Exceptional 11.8% |
| Immigrants | Latvia | 95.6 /100 | #128 | Exceptional 11.8% |
| Macedonians | 95.5 /100 | #129 | Exceptional 11.8% |
| Nicaraguans | 95.2 /100 | #130 | Exceptional 11.9% |
| Arabs | 95.1 /100 | #131 | Exceptional 11.9% |
| Immigrants | Syria | 94.6 /100 | #132 | Exceptional 11.9% |
| Kenyans | 94.5 /100 | #133 | Exceptional 11.9% |
| Immigrants | Nicaragua | 94.5 /100 | #134 | Exceptional 11.9% |
| Central Americans | 94.2 /100 | #135 | Exceptional 11.9% |
| Ugandans | 94.0 /100 | #136 | Exceptional 11.9% |
| Immigrants | Norway | 93.8 /100 | #137 | Exceptional 11.9% |
| Ecuadorians | 93.4 /100 | #138 | Exceptional 11.9% |
| Immigrants | Hungary | 92.8 /100 | #139 | Exceptional 11.9% |
| Romanians | 91.6 /100 | #140 | Exceptional 11.9% |
| Immigrants | Ecuador | 91.5 /100 | #141 | Exceptional 11.9% |
| Immigrants | Africa | 90.0 /100 | #142 | Excellent 11.9% |
| Immigrants | Sudan | 89.6 /100 | #143 | Excellent 11.9% |
| Immigrants | Austria | 87.9 /100 | #144 | Excellent 12.0% |