Immigrants from Austria vs Estonian Female Disability
COMPARE
Immigrants from Austria
Estonian
Female Disability
Female Disability Comparison
Immigrants from Austria
Estonians
12.0%
FEMALE DISABILITY
87.9/ 100
METRIC RATING
144th/ 347
METRIC RANK
12.0%
FEMALE DISABILITY
87.8/ 100
METRIC RATING
145th/ 347
METRIC RANK
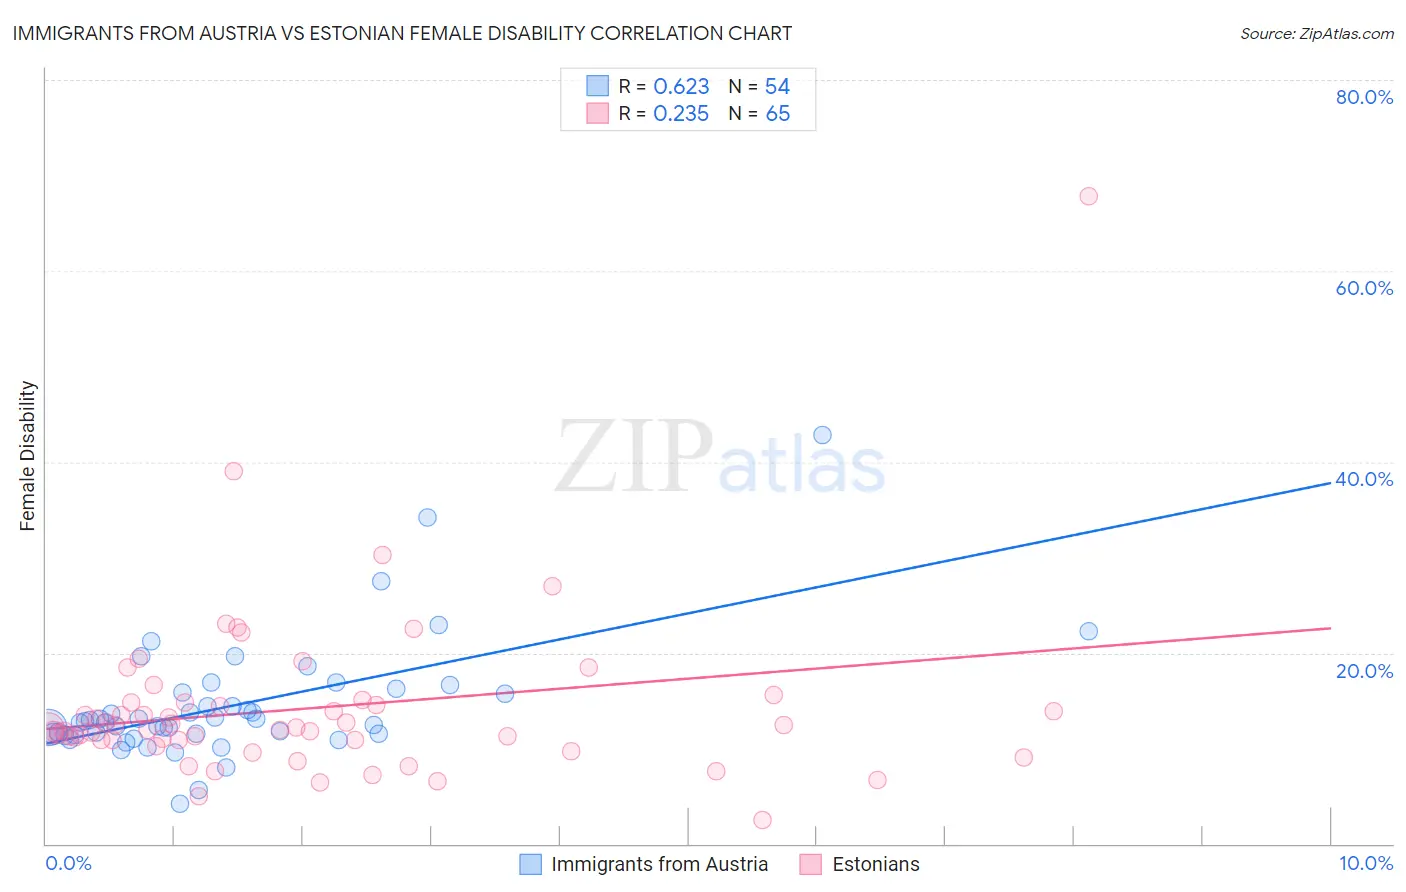
Immigrants from Austria vs Estonian Female Disability Correlation Chart
The statistical analysis conducted on geographies consisting of 167,970,521 people shows a significant positive correlation between the proportion of Immigrants from Austria and percentage of females with a disability in the United States with a correlation coefficient (R) of 0.623 and weighted average of 12.0%. Similarly, the statistical analysis conducted on geographies consisting of 123,526,359 people shows a weak positive correlation between the proportion of Estonians and percentage of females with a disability in the United States with a correlation coefficient (R) of 0.235 and weighted average of 12.0%, a difference of 0.0%.
Female Disability Correlation Summary
| Measurement | Immigrants from Austria | Estonian |
| Minimum | 4.2% | 2.4% |
| Maximum | 42.9% | 67.8% |
| Range | 38.7% | 65.4% |
| Mean | 14.5% | 14.2% |
| Median | 12.8% | 12.1% |
| Interquartile 25% (IQ1) | 11.5% | 10.8% |
| Interquartile 75% (IQ3) | 15.9% | 14.8% |
| Interquartile Range (IQR) | 4.4% | 3.9% |
| Standard Deviation (Sample) | 6.3% | 9.0% |
| Standard Deviation (Population) | 6.3% | 8.9% |
Demographics Similar to Immigrants from Austria and Estonians by Female Disability
In terms of female disability, the demographic groups most similar to Immigrants from Austria are Immigrants from Sudan (11.9%, a difference of 0.17%), Immigrants from Africa (11.9%, a difference of 0.21%), Pakistani (12.0%, a difference of 0.27%), Nigerian (12.0%, a difference of 0.30%), and Immigrants from Kenya (12.0%, a difference of 0.37%). Similarly, the demographic groups most similar to Estonians are Immigrants from Sudan (11.9%, a difference of 0.17%), Immigrants from Africa (11.9%, a difference of 0.21%), Pakistani (12.0%, a difference of 0.26%), Nigerian (12.0%, a difference of 0.30%), and Immigrants from Kenya (12.0%, a difference of 0.37%).
| Demographics | Rating | Rank | Female Disability |
| Immigrants | Nicaragua | 94.5 /100 | #134 | Exceptional 11.9% |
| Central Americans | 94.2 /100 | #135 | Exceptional 11.9% |
| Ugandans | 94.0 /100 | #136 | Exceptional 11.9% |
| Immigrants | Norway | 93.8 /100 | #137 | Exceptional 11.9% |
| Ecuadorians | 93.4 /100 | #138 | Exceptional 11.9% |
| Immigrants | Hungary | 92.8 /100 | #139 | Exceptional 11.9% |
| Romanians | 91.6 /100 | #140 | Exceptional 11.9% |
| Immigrants | Ecuador | 91.5 /100 | #141 | Exceptional 11.9% |
| Immigrants | Africa | 90.0 /100 | #142 | Excellent 11.9% |
| Immigrants | Sudan | 89.6 /100 | #143 | Excellent 11.9% |
| Immigrants | Austria | 87.9 /100 | #144 | Excellent 12.0% |
| Estonians | 87.8 /100 | #145 | Excellent 12.0% |
| Pakistanis | 84.6 /100 | #146 | Excellent 12.0% |
| Nigerians | 84.0 /100 | #147 | Excellent 12.0% |
| Immigrants | Kenya | 83.1 /100 | #148 | Excellent 12.0% |
| Greeks | 82.0 /100 | #149 | Excellent 12.0% |
| Immigrants | Moldova | 81.4 /100 | #150 | Excellent 12.0% |
| Icelanders | 80.7 /100 | #151 | Excellent 12.0% |
| Immigrants | Scotland | 79.3 /100 | #152 | Good 12.0% |
| Sudanese | 79.1 /100 | #153 | Good 12.0% |
| Syrians | 76.9 /100 | #154 | Good 12.1% |