Malaysian vs White/Caucasian Female Disability
COMPARE
Malaysian
White/Caucasian
Female Disability
Female Disability Comparison
Malaysians
Whites/Caucasians
12.5%
FEMALE DISABILITY
5.0/ 100
METRIC RATING
235th/ 347
METRIC RANK
13.2%
FEMALE DISABILITY
0.0/ 100
METRIC RATING
288th/ 347
METRIC RANK
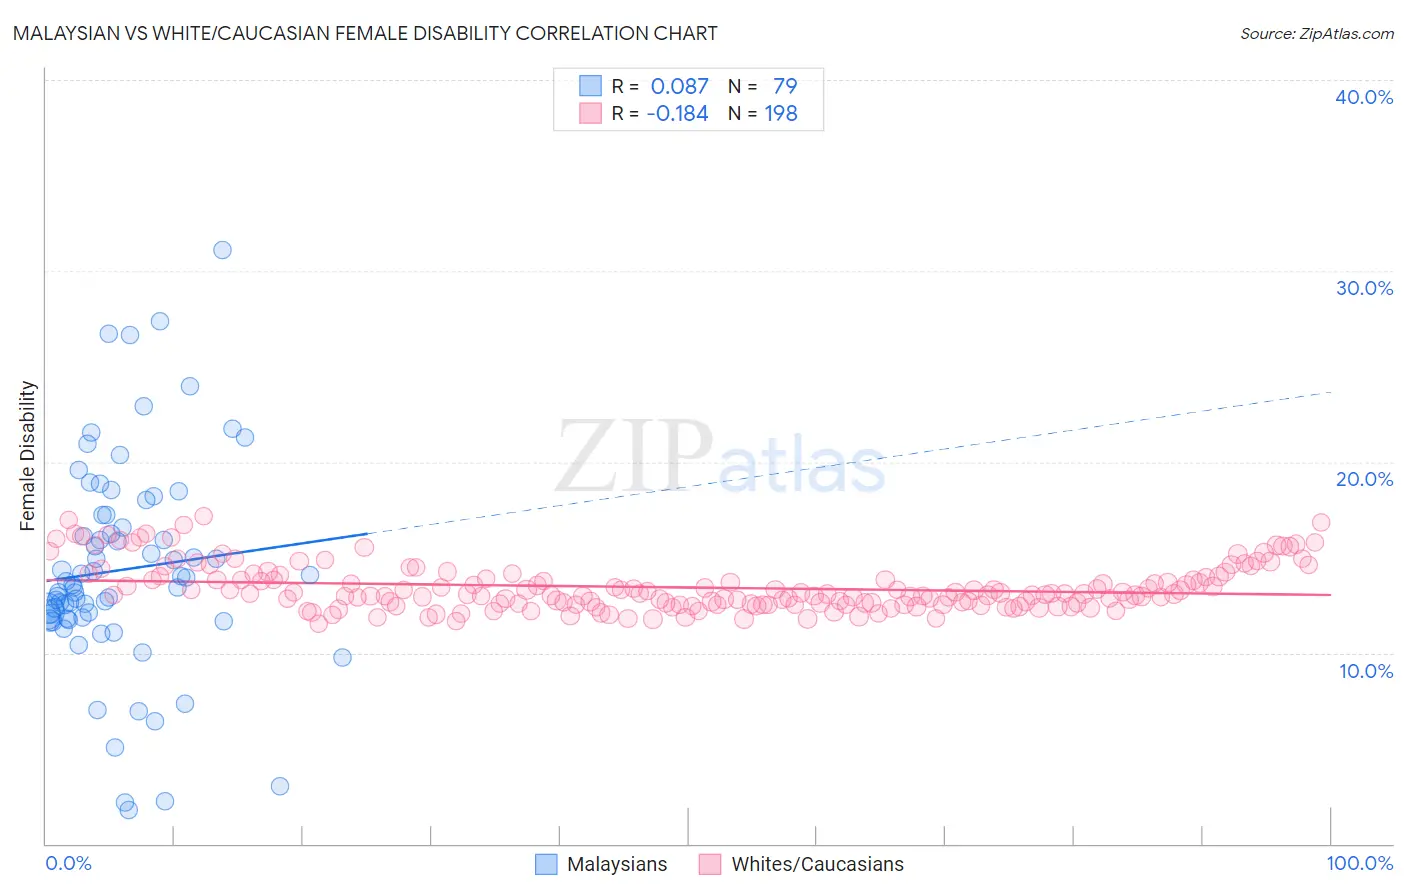
Malaysian vs White/Caucasian Female Disability Correlation Chart
The statistical analysis conducted on geographies consisting of 226,065,175 people shows a slight positive correlation between the proportion of Malaysians and percentage of females with a disability in the United States with a correlation coefficient (R) of 0.087 and weighted average of 12.5%. Similarly, the statistical analysis conducted on geographies consisting of 582,775,170 people shows a poor negative correlation between the proportion of Whites/Caucasians and percentage of females with a disability in the United States with a correlation coefficient (R) of -0.184 and weighted average of 13.2%, a difference of 5.2%.
Female Disability Correlation Summary
| Measurement | Malaysian | White/Caucasian |
| Minimum | 1.8% | 11.5% |
| Maximum | 31.1% | 17.2% |
| Range | 29.3% | 5.6% |
| Mean | 14.3% | 13.4% |
| Median | 13.5% | 13.1% |
| Interquartile 25% (IQ1) | 11.8% | 12.5% |
| Interquartile 75% (IQ3) | 17.2% | 14.0% |
| Interquartile Range (IQR) | 5.4% | 1.5% |
| Standard Deviation (Sample) | 5.5% | 1.2% |
| Standard Deviation (Population) | 5.5% | 1.2% |
Similar Demographics by Female Disability
Demographics Similar to Malaysians by Female Disability
In terms of female disability, the demographic groups most similar to Malaysians are Scandinavian (12.5%, a difference of 0.050%), Immigrants from Iraq (12.5%, a difference of 0.060%), Immigrants from West Indies (12.6%, a difference of 0.13%), Immigrants from Somalia (12.5%, a difference of 0.17%), and Belgian (12.5%, a difference of 0.25%).
| Demographics | Rating | Rank | Female Disability |
| Immigrants | Cambodia | 7.8 /100 | #228 | Tragic 12.5% |
| Hungarians | 7.2 /100 | #229 | Tragic 12.5% |
| Immigrants | Belize | 7.0 /100 | #230 | Tragic 12.5% |
| Belgians | 6.5 /100 | #231 | Tragic 12.5% |
| Immigrants | Somalia | 5.9 /100 | #232 | Tragic 12.5% |
| Immigrants | Iraq | 5.3 /100 | #233 | Tragic 12.5% |
| Scandinavians | 5.3 /100 | #234 | Tragic 12.5% |
| Malaysians | 5.0 /100 | #235 | Tragic 12.5% |
| Immigrants | West Indies | 4.4 /100 | #236 | Tragic 12.6% |
| Slavs | 3.8 /100 | #237 | Tragic 12.6% |
| Yugoslavians | 3.7 /100 | #238 | Tragic 12.6% |
| Barbadians | 3.6 /100 | #239 | Tragic 12.6% |
| German Russians | 3.2 /100 | #240 | Tragic 12.6% |
| Japanese | 2.7 /100 | #241 | Tragic 12.6% |
| Canadians | 2.6 /100 | #242 | Tragic 12.6% |
Demographics Similar to Whites/Caucasians by Female Disability
In terms of female disability, the demographic groups most similar to Whites/Caucasians are Yaqui (13.2%, a difference of 0.10%), Tlingit-Haida (13.2%, a difference of 0.17%), Immigrants from Yemen (13.2%, a difference of 0.18%), Shoshone (13.2%, a difference of 0.24%), and Yakama (13.2%, a difference of 0.40%).
| Demographics | Rating | Rank | Female Disability |
| U.S. Virgin Islanders | 0.1 /100 | #281 | Tragic 13.1% |
| Welsh | 0.0 /100 | #282 | Tragic 13.1% |
| English | 0.0 /100 | #283 | Tragic 13.1% |
| Hmong | 0.0 /100 | #284 | Tragic 13.1% |
| Bangladeshis | 0.0 /100 | #285 | Tragic 13.1% |
| Fijians | 0.0 /100 | #286 | Tragic 13.1% |
| Yaqui | 0.0 /100 | #287 | Tragic 13.2% |
| Whites/Caucasians | 0.0 /100 | #288 | Tragic 13.2% |
| Tlingit-Haida | 0.0 /100 | #289 | Tragic 13.2% |
| Immigrants | Yemen | 0.0 /100 | #290 | Tragic 13.2% |
| Shoshone | 0.0 /100 | #291 | Tragic 13.2% |
| Yakama | 0.0 /100 | #292 | Tragic 13.2% |
| Marshallese | 0.0 /100 | #293 | Tragic 13.3% |
| Celtics | 0.0 /100 | #294 | Tragic 13.3% |
| French | 0.0 /100 | #295 | Tragic 13.3% |