Central American vs Immigrants from India Cognitive Disability
COMPARE
Central American
Immigrants from India
Cognitive Disability
Cognitive Disability Comparison
Central Americans
Immigrants from India
17.7%
COGNITIVE DISABILITY
4.5/ 100
METRIC RATING
222nd/ 347
METRIC RANK
15.9%
COGNITIVE DISABILITY
100.0/ 100
METRIC RATING
2nd/ 347
METRIC RANK
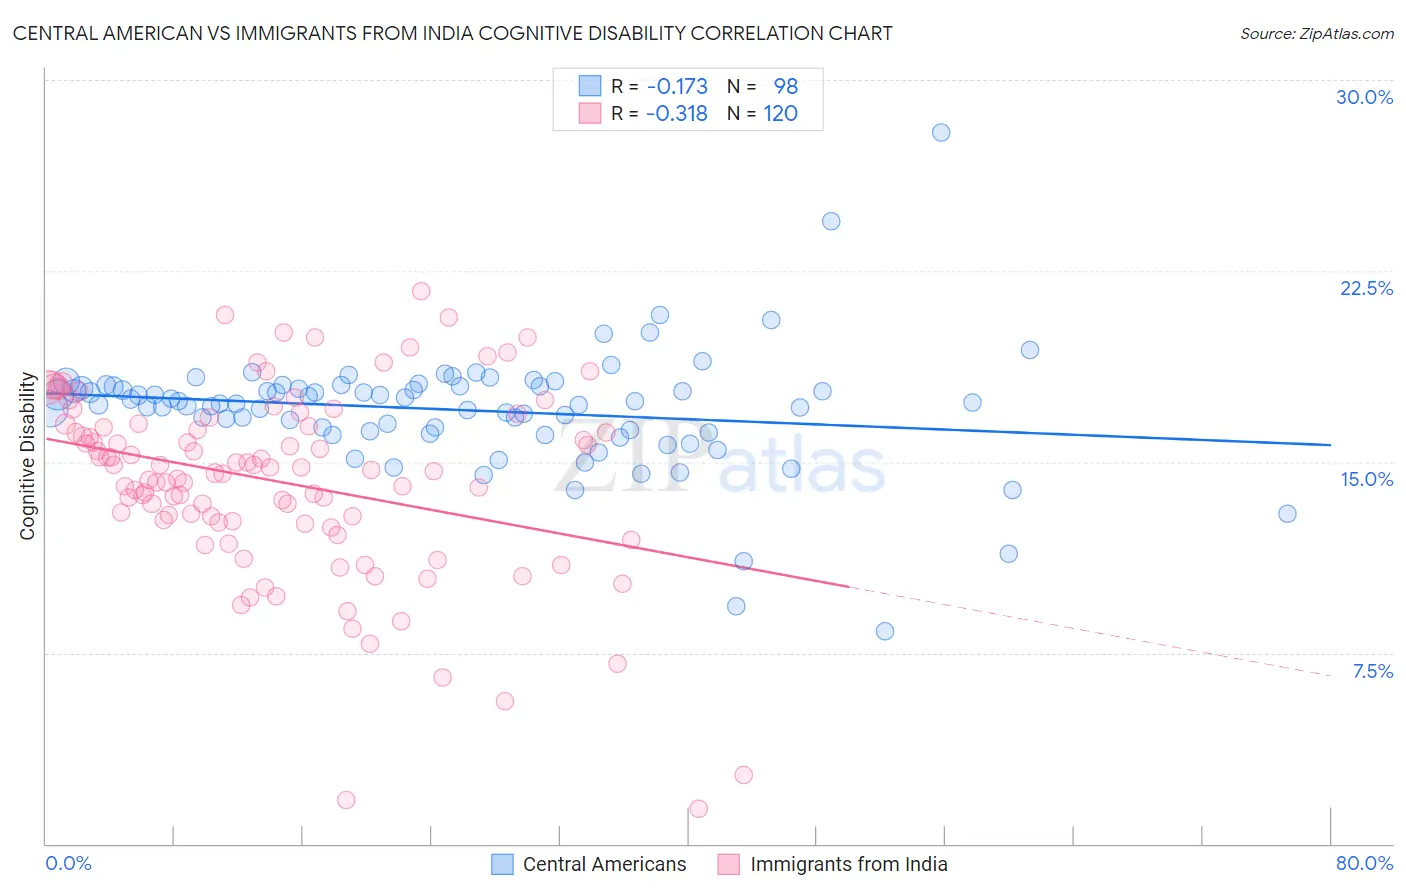
Central American vs Immigrants from India Cognitive Disability Correlation Chart
The statistical analysis conducted on geographies consisting of 504,492,457 people shows a poor negative correlation between the proportion of Central Americans and percentage of population with cognitive disability in the United States with a correlation coefficient (R) of -0.173 and weighted average of 17.7%. Similarly, the statistical analysis conducted on geographies consisting of 434,093,064 people shows a mild negative correlation between the proportion of Immigrants from India and percentage of population with cognitive disability in the United States with a correlation coefficient (R) of -0.318 and weighted average of 15.9%, a difference of 10.9%.
Cognitive Disability Correlation Summary
| Measurement | Central American | Immigrants from India |
| Minimum | 8.3% | 1.4% |
| Maximum | 27.9% | 21.7% |
| Range | 19.6% | 20.3% |
| Mean | 17.0% | 14.2% |
| Median | 17.3% | 14.6% |
| Interquartile 25% (IQ1) | 16.2% | 12.7% |
| Interquartile 75% (IQ3) | 18.0% | 16.4% |
| Interquartile Range (IQR) | 1.8% | 3.8% |
| Standard Deviation (Sample) | 2.4% | 3.7% |
| Standard Deviation (Population) | 2.4% | 3.7% |
Similar Demographics by Cognitive Disability
Demographics Similar to Central Americans by Cognitive Disability
In terms of cognitive disability, the demographic groups most similar to Central Americans are Alsatian (17.7%, a difference of 0.010%), Moroccan (17.6%, a difference of 0.20%), Fijian (17.7%, a difference of 0.20%), Vietnamese (17.7%, a difference of 0.21%), and Zimbabwean (17.6%, a difference of 0.22%).
| Demographics | Rating | Rank | Cognitive Disability |
| Alaskan Athabascans | 6.9 /100 | #215 | Tragic 17.6% |
| Okinawans | 6.8 /100 | #216 | Tragic 17.6% |
| Salvadorans | 6.7 /100 | #217 | Tragic 17.6% |
| Icelanders | 6.4 /100 | #218 | Tragic 17.6% |
| Immigrants | Sierra Leone | 6.3 /100 | #219 | Tragic 17.6% |
| Zimbabweans | 6.1 /100 | #220 | Tragic 17.6% |
| Moroccans | 5.9 /100 | #221 | Tragic 17.6% |
| Central Americans | 4.5 /100 | #222 | Tragic 17.7% |
| Alsatians | 4.5 /100 | #223 | Tragic 17.7% |
| Fijians | 3.4 /100 | #224 | Tragic 17.7% |
| Vietnamese | 3.4 /100 | #225 | Tragic 17.7% |
| Marshallese | 2.7 /100 | #226 | Tragic 17.7% |
| Immigrants | St. Vincent and the Grenadines | 2.6 /100 | #227 | Tragic 17.7% |
| Immigrants | Central America | 2.3 /100 | #228 | Tragic 17.7% |
| Immigrants | Guatemala | 2.2 /100 | #229 | Tragic 17.7% |
Demographics Similar to Immigrants from India by Cognitive Disability
In terms of cognitive disability, the demographic groups most similar to Immigrants from India are Chinese (15.9%, a difference of 0.080%), Immigrants from Lithuania (16.0%, a difference of 0.27%), Immigrants from Hong Kong (16.0%, a difference of 0.68%), Immigrants from Taiwan (15.7%, a difference of 1.3%), and Thai (16.1%, a difference of 1.3%).
| Demographics | Rating | Rank | Cognitive Disability |
| Immigrants | Taiwan | 100.0 /100 | #1 | Exceptional 15.7% |
| Immigrants | India | 100.0 /100 | #2 | Exceptional 15.9% |
| Chinese | 100.0 /100 | #3 | Exceptional 15.9% |
| Immigrants | Lithuania | 100.0 /100 | #4 | Exceptional 16.0% |
| Immigrants | Hong Kong | 100.0 /100 | #5 | Exceptional 16.0% |
| Thais | 100.0 /100 | #6 | Exceptional 16.1% |
| Immigrants | Ireland | 100.0 /100 | #7 | Exceptional 16.1% |
| Immigrants | Poland | 100.0 /100 | #8 | Exceptional 16.1% |
| Assyrians/Chaldeans/Syriacs | 100.0 /100 | #9 | Exceptional 16.2% |
| Immigrants | Scotland | 100.0 /100 | #10 | Exceptional 16.2% |
| Immigrants | Czechoslovakia | 100.0 /100 | #11 | Exceptional 16.2% |
| Maltese | 100.0 /100 | #12 | Exceptional 16.2% |
| Lithuanians | 100.0 /100 | #13 | Exceptional 16.3% |
| Immigrants | Austria | 100.0 /100 | #14 | Exceptional 16.3% |
| Immigrants | Greece | 100.0 /100 | #15 | Exceptional 16.3% |