Immigrants from Australia vs Immigrants from Guyana Cognitive Disability
COMPARE
Immigrants from Australia
Immigrants from Guyana
Cognitive Disability
Cognitive Disability Comparison
Immigrants from Australia
Immigrants from Guyana
17.1%
COGNITIVE DISABILITY
76.0/ 100
METRIC RATING
157th/ 347
METRIC RANK
17.3%
COGNITIVE DISABILITY
42.9/ 100
METRIC RATING
181st/ 347
METRIC RANK
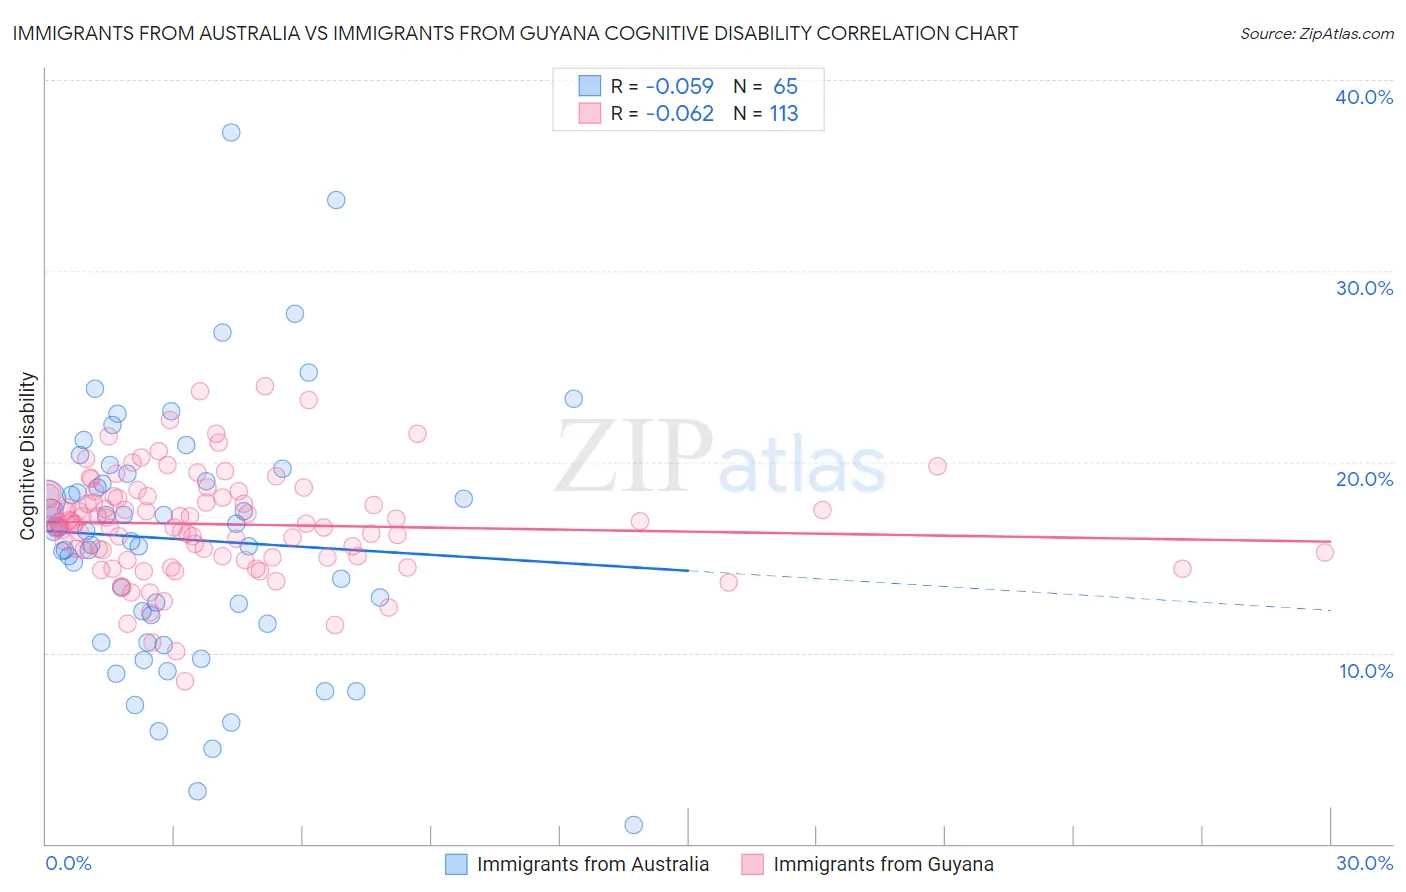
Immigrants from Australia vs Immigrants from Guyana Cognitive Disability Correlation Chart
The statistical analysis conducted on geographies consisting of 227,201,073 people shows a slight negative correlation between the proportion of Immigrants from Australia and percentage of population with cognitive disability in the United States with a correlation coefficient (R) of -0.059 and weighted average of 17.1%. Similarly, the statistical analysis conducted on geographies consisting of 183,699,150 people shows a slight negative correlation between the proportion of Immigrants from Guyana and percentage of population with cognitive disability in the United States with a correlation coefficient (R) of -0.062 and weighted average of 17.3%, a difference of 1.0%.
Cognitive Disability Correlation Summary
| Measurement | Immigrants from Australia | Immigrants from Guyana |
| Minimum | 0.98% | 8.5% |
| Maximum | 37.3% | 24.0% |
| Range | 36.3% | 15.5% |
| Mean | 15.9% | 16.7% |
| Median | 16.4% | 16.7% |
| Interquartile 25% (IQ1) | 11.8% | 15.1% |
| Interquartile 75% (IQ3) | 19.2% | 18.2% |
| Interquartile Range (IQR) | 7.4% | 3.1% |
| Standard Deviation (Sample) | 6.6% | 2.7% |
| Standard Deviation (Population) | 6.5% | 2.7% |
Similar Demographics by Cognitive Disability
Demographics Similar to Immigrants from Australia by Cognitive Disability
In terms of cognitive disability, the demographic groups most similar to Immigrants from Australia are Celtic (17.1%, a difference of 0.070%), Immigrants from Latvia (17.2%, a difference of 0.11%), Brazilian (17.1%, a difference of 0.12%), Sri Lankan (17.1%, a difference of 0.12%), and Immigrants from Malaysia (17.1%, a difference of 0.14%).
| Demographics | Rating | Rank | Cognitive Disability |
| Basques | 85.5 /100 | #150 | Excellent 17.1% |
| Syrians | 83.0 /100 | #151 | Excellent 17.1% |
| Immigrants | Indonesia | 82.7 /100 | #152 | Excellent 17.1% |
| Immigrants | Kazakhstan | 80.5 /100 | #153 | Excellent 17.1% |
| Immigrants | Malaysia | 79.3 /100 | #154 | Good 17.1% |
| Brazilians | 78.9 /100 | #155 | Good 17.1% |
| Sri Lankans | 78.9 /100 | #156 | Good 17.1% |
| Immigrants | Australia | 76.0 /100 | #157 | Good 17.1% |
| Celtics | 74.1 /100 | #158 | Good 17.1% |
| Immigrants | Latvia | 73.2 /100 | #159 | Good 17.2% |
| Australians | 72.4 /100 | #160 | Good 17.2% |
| Americans | 72.2 /100 | #161 | Good 17.2% |
| Yugoslavians | 71.6 /100 | #162 | Good 17.2% |
| Immigrants | Switzerland | 71.5 /100 | #163 | Good 17.2% |
| Armenians | 70.1 /100 | #164 | Good 17.2% |
Demographics Similar to Immigrants from Guyana by Cognitive Disability
In terms of cognitive disability, the demographic groups most similar to Immigrants from Guyana are Arab (17.3%, a difference of 0.0%), Pakistani (17.3%, a difference of 0.030%), Spaniard (17.3%, a difference of 0.070%), Crow (17.3%, a difference of 0.11%), and Afghan (17.3%, a difference of 0.14%).
| Demographics | Rating | Rank | Cognitive Disability |
| Laotians | 50.0 /100 | #174 | Average 17.3% |
| Tsimshian | 49.8 /100 | #175 | Average 17.3% |
| Shoshone | 49.2 /100 | #176 | Average 17.3% |
| Ute | 49.1 /100 | #177 | Average 17.3% |
| Spanish | 48.9 /100 | #178 | Average 17.3% |
| Sioux | 48.6 /100 | #179 | Average 17.3% |
| Pakistanis | 43.9 /100 | #180 | Average 17.3% |
| Immigrants | Guyana | 42.9 /100 | #181 | Average 17.3% |
| Arabs | 42.8 /100 | #182 | Average 17.3% |
| Spaniards | 40.3 /100 | #183 | Average 17.3% |
| Crow | 39.1 /100 | #184 | Fair 17.3% |
| Afghans | 38.2 /100 | #185 | Fair 17.3% |
| Cambodians | 35.9 /100 | #186 | Fair 17.3% |
| Immigrants | Fiji | 33.7 /100 | #187 | Fair 17.4% |
| Immigrants | France | 29.8 /100 | #188 | Fair 17.4% |